Quantcast
Channel: dotMemory : .NET Tools | The JetBrains Blog
Viewing all 306 articles
Browse latest View live

Introducing dotMemory Video Tutorials

$
0
0

Great news for .NET memory investigators, with the help from our technical evangelist Maarten Balliauw we have prepared a series of short videos that cover some of the core features of dotMemory.

dotMemory

These video tutorials should be a good starting point for users who are new to dotMemory and just starting to explore its functionality. It is focused around core features available in dotMemory, explained in short videos of 2-4 minutes each. You can learn basic concepts of .NET memory management, profiling workflow, analysis techniques and more.

32 minutes and 11 videos to watch:

Stay tuned! Subscribe to JetBrains YouTube channel and follow @dotMemory on Twitter to be notified when new videos arrived.

Maarten BalliauwMaarten Balliauw is a Technical Evangelist at JetBrains. His interests are all web: ASP.NET MVC, PHP and Windows Azure. He’s a Microsoft Most Valuable Professional (MVP) for Windows Azure and an ASPInsider. He has published many articles in both PHP and .NET literature such as MSDN magazine and PHP architect. Maarten is a frequent speaker at various national and international events such as MIX (Las Vegas), TechDays, DPC and others..

Enjoy the show!
dotMemory Team


dotMemory 4.1 is Released: 6+ Reasons to Upgrade

$
0
0

Today we are thrilled to introduce dotMemory 4.1 with a new batch of .NET memory profiling goodies regarding automatic inspections, profiling process control, GC roots data, and more. Please welcome dotMemory 4.1, bringing you more rigorous, convenient and beautiful profiling experience.
dotMemory 4.1 splash screen

Why upgrade to dotMemory 4.1? For at least 6 reasons:

1: Disable/Enable collection allocations on the fly.
To profile certain functionality of your app without slowing down all of its other areas, try disabling allocations collection directly from the real-time profiling control view. For your convenience allocations collection period is marked by red line on a timeline.
Collection Allocations

2: Get more data on GC roots.
Starting from this update, dotMemory shows you the name of the field through which a static object is referenced. Later we plan to publish a good read on GC roots basics, so stay tuned.
Named static reference

3: Detect more common issues in a single click.
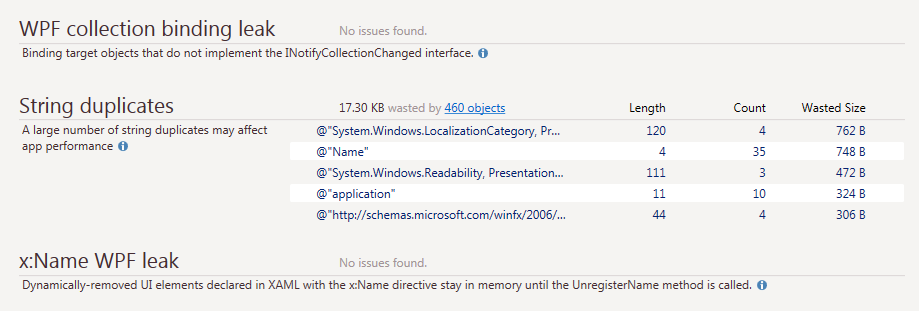
To help you focus on what really needs your attention, we’ve added a new automatic inspection that finds String duplicates and shows the related memory waste. Two more recently added automatic inspections, both related to WPF, were announced earlier in v4.0.10.
String duplicates inspection

4: Copy, save and share profiling results.
Simply press Ctrl+C to copy current analysis results to the clipboard. Selection and copying of multiple rows is supported for all “Type List” views, all nicely formatted and ready to be compared or shared.
Formatted copy of analysis results

5: Enjoy new restyled UI icons. Our notion of profiling is that it should be clear, productive and even beautiful. That’s why this update features new great-looking UI icons for your viewing pleasure.
Refreshed UI icons

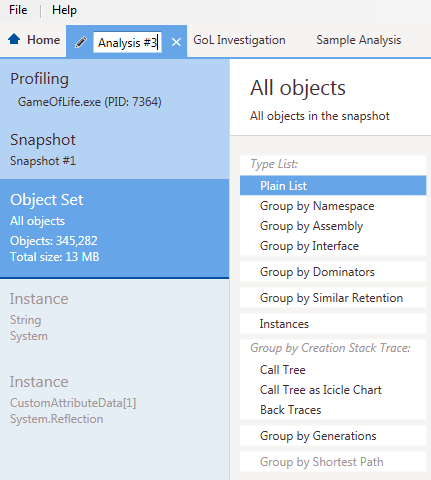
6: Name your analysis. Easily order and manage multiple memory investigations by providing your analysis tabs with custom names. Never again get lost in loads of various unnamed analyses.
Custom analysis name

+: Even more reasons?
To get the full list of enhancement and fixes, please see the release notes.

Discover all new features introduced in dotMemory 4.1 in this short Overview Demo.

Download dotMemory 4.1 and try out all the new things shipped with this update. Learn more about dotMemory 4.1 on the What’s New page. A free trial version is available for 10 actual days of use (even if they are non-consecutive). Note for existing customers: To use this update, you will need an active subscription.

Feel free to share any feedback you may have. Ask questions on the discussion forum, report bugs and feature requests to our issue tracker and/or leave comments on this blog post below. Follow @dotMemory on twitter to stay tuned about state of the art in .NET memory profiling. And to raise your skills in spotting .NET memory issues with dotMemory, watch this series of video tutorials by Maarten Balliauw, JetBrains Technical Evangelist.

Profile with pleasure!
dotMemory team

Introducing EAPs for dotTrace 6, dotCover 3, dotMemory 4.2

$
0
0

Please welcome a new ReSharper 9 EAP build that comes along with compatible dotTrace 6, dotCover 3 and dotMemory 4.2 Early Access builds.

Download the common .NET tools installer, launch it and choose the products you want to try.

We’ve done a great amount of work on the UI side, resulting in a more pleasant and easy-to-use profiling experience with dotTrace 6 EAP. A number of new features were also implemented, as well as the new and powerful timeline profiling option. Let’s have a look at what’s new.

dotTrace Home

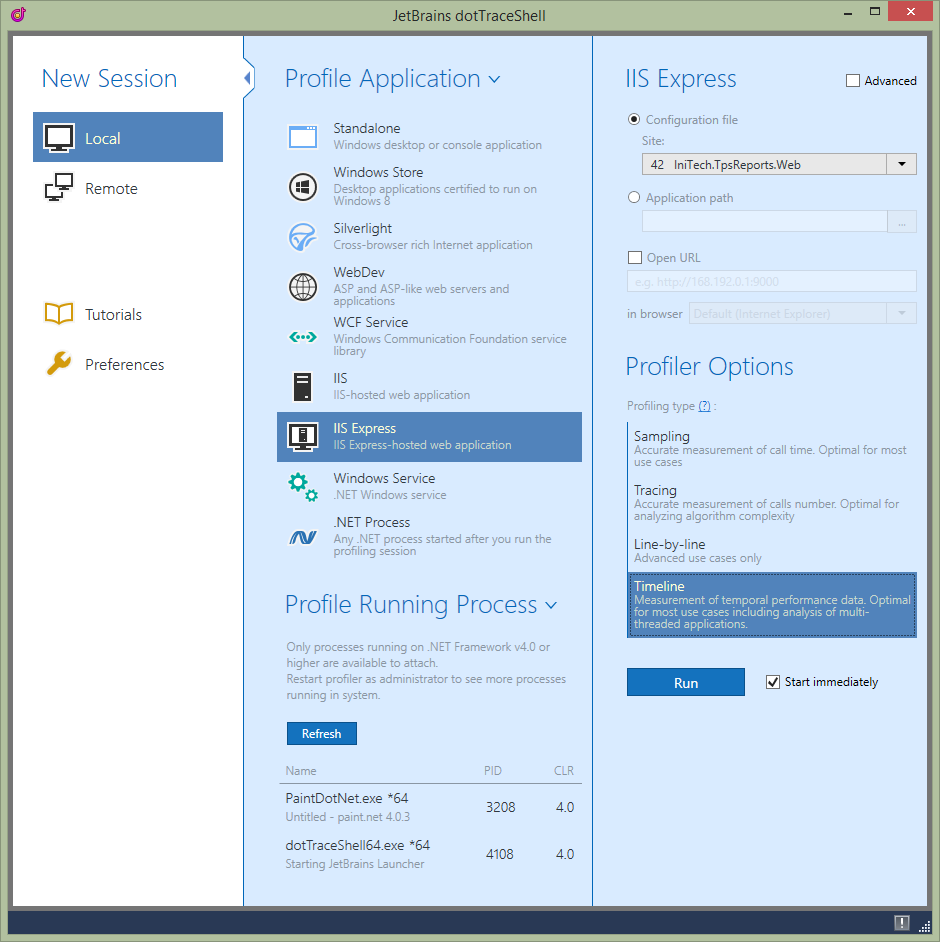
When launching dotTrace 6, we’ll be presented with an all-new starting point: the dotTrace Home. From here, we can start a new local or remote profiling session for known .NET application types, attach to a running process and configure our profiling session.

dotTrace Home

Every application type will offer different settings for running the application we want to profile. Ticking the Advanced checkbox will provide us with additional options, such as using the profiler API.

If you’re new to performance profiling, check the Tutorials section on the home screen. We’ll guide you through how dotTrace works and how to analyze the data that was collected by the profiler.

Enhanced Profiling Controller

After launching a profiling session, we’ll see a new profiling controller open. We can use it to start the profiler, generate a snapshot, specify whether the profiler should continue capturing data or not, detach the profiler, or kill the running process.

Controller

With dotTrace 6 you can expand the profiling controller, providing you insight into the realtime CPU and memory usage of your application.

Profiler controller showing realtime CPU and memory usage

When our application runs multiple processes, we can select to profile any of them from the Processes page. Note that the Profile child processes option must be enabled for this to take effect.

Timeline Profiling

We’re introducing a new profiling type with dotTrace 6: Timeline profiling.

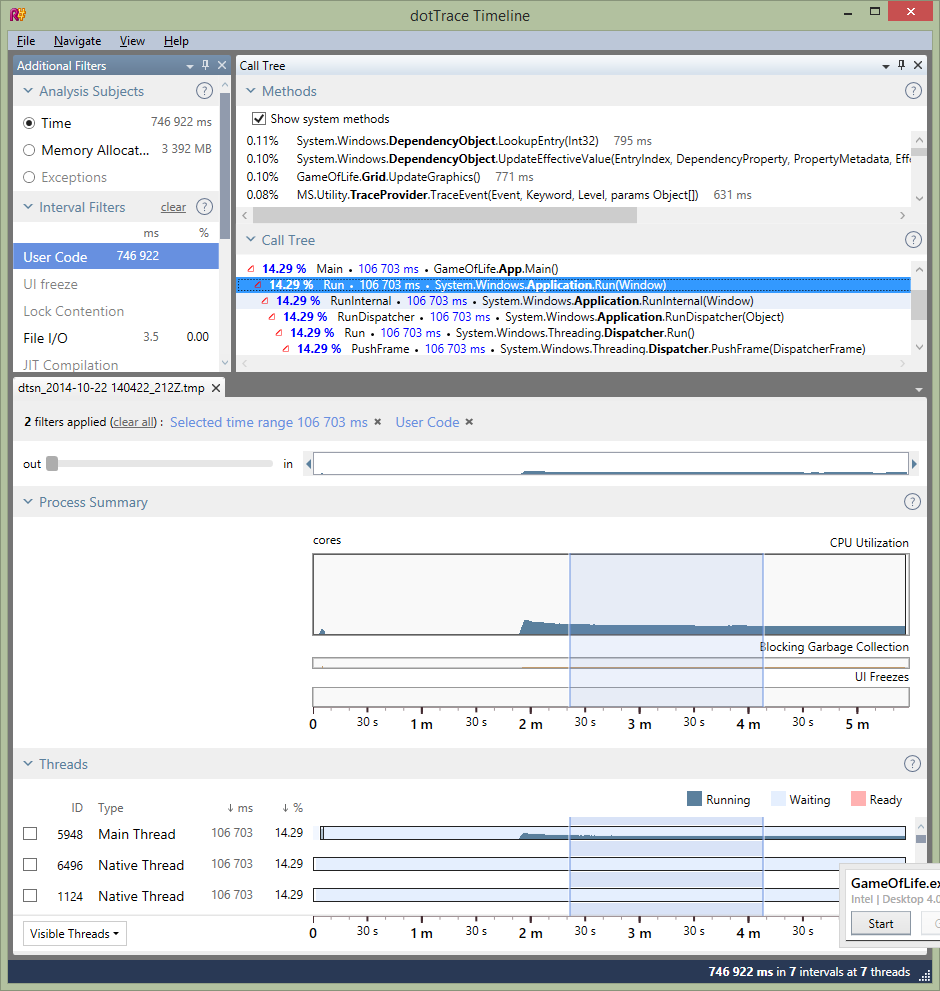
Timeline profiling collects temporal data about thread states, application events and other multi-threading data using Event Tracing for Windows (ETW). It comes in handy when analyzing multithreaded applications and lets us determine the cause of UI freezes, excessive garbage collections, uneven workload distribution, insufficient I/O and so on. The main advantage of Timeline profiling is that it not only allows us to see which calls were made by our application, but also how these calls were distributed over time.

Analyzing timeline profiling snapshots is similar to analyzing other profiling type results, with one difference: everything is bound to the timeline. We can view all events, or zoom in on a particular timespan of our application’s runtime and analyze the call tree, threads, memory allocation, garbage collection and I/O events.

Timeline profiling for multithreaded applications

In general, we can use timeline profiling all the time: just like the other profiling types it collects call stack data and allows us to determine performance bottlenecks. It is unable to determine the exact number of performed calls, making it less suitable to analyze algorithms, but that’s where tracing and line-by-line profiling are the tools of the trade.

Dissolved and Hidden Subsystems

When analyzing profiling results, we get a broad overview of subsystems used by our application. This gives us a hunch of where most time is spent: in the UI, in user code, with Garbage Collection, with I/O and so on. We can even define our own subsystems.

dotTrace subsystems view

From the options, dotTrace now lets us dissolve or hide subsystems. By default, each subsystem is visible as an entry in the subsystems pane. Making a subsystem dissolve will account the call times to its caller. Hidden subsystems will not be counted in results.

Subsystems now dissolvable or hidden

Setting these options for existing or new subsystems lets us slice and dice the profiling results in such a way that we only see the data we’re interested in.

Various UI Improvements in dotTrace 6 and dotCover 3

dotTrace 6 is now sharing a unified UI framework with ReSharper, dotCover and dotPeek. This brings an experience consistent to Visual Studio to the latest version of our profiler. All tabs and panes can be docked wherever we want, or detached from the main window so they float around. Very useful in multi-monitor setups! dotCover 3 receives a new UI for configuration settings dialog box.

Code Coverage in dotCover 3 on a Remote Machine

Code analysis in dotCover 3 can be performed on a remote machine. Set up a server and run it as a console application or Windows service on a remote machine. To perform code coverage, one needs to navigate to C:\Users\username\AppData\Local\JetBrains\Installations\dotCover01. Then, launch dotCover.RemoteCoverageServer.exe and connect to the server from the menu ReSharper -> Options -> dotCover -> Remote Coverage. In this scenario all the coverage tests are running on a remote server. This can save you a vast of performance resources on your local machine.

The Customary Trial Pitch

Give the latest versions of dotTrace 6 EAP, dotCover 3 EAP and dotMemory 4.2 EAP a try! Download the common .NET tools installer and choose products to install. Please note that doing so will remove all previous installations of ReSharper and other JetBrains .NET tools from Visual Studio, plus VS2005 and VS2008 are not supported so far.

All feedback, comments, issues and suggestions are welcome in dotTrace, dotCover and dotMemory issue trackers or through the comments below.

Meet ReSharper, ReSharper C++ and ReSharper Ultimate

$
0
0

We’d like to give a preview of updates to JetBrains .NET product line that will become effective as soon as ReSharper 9 and other JetBrains .NET tools are released in coming weeks.

TL;DR: ReSharper editions (C#, VB.NET and Full) are going away. Instead, the ReSharper product line will now consist of 3 items:

  • ReSharper (formerly Full Edition: C#, VB.NET, XAML and other languages traditionally supported by ReSharper; no C++ support),
  • ReSharper C++ (C++ support only)
  • ReSharper Ultimate (includes both ReSharper and ReSharper C++, as well as dotCover, dotTrace and doMemory.)

Please see details below, along with answers to some of the questions that we expect to be asked.

How exactly is the set of ReSharper products going to change?

ReSharper is currently available in 3 editions: C# Edition (includes all features except for VB.NET support), VB.NET Edition (includes all features except C# support), and Full Edition (includes everything that ReSharper has to offer.)

Starting with the release of ReSharper 9 next month, C# Edition and VB.NET Edition are going away, Full Edition becomes referred to as simply ReSharper, and two additional products become available. The diff looks as follows:

  • ReSharper C# Edition. Will no longer be available.
  • ReSharper VB.NET Edition. Will no longer be available.
  • What has been known as ReSharper Full Edition will now be referred to as simply ReSharper. This will include all ReSharper functionality available in the current Full Edition, including support for C#, VB.NET, ASP.NET, JavaScript, TypeScript, HTML, CSS, XAML and build scripts. However C++ support will not be available in this product. If you have an active ReSharper upgrade subscription to C#, VB.NET or Full Edition by the time of ReSharper 9 release, you will be able to upgrade to ReSharper 9 for free.
  • ReSharper C++. This is a new offering in the ReSharper product line and will only provide C++ support.
  • ReSharper Ultimate. This is also new. ReSharper Ultimate will provide all ReSharper functionality including C++ support, and it will also include all other commercial JetBrains .NET tools: the set that currently consists of dotCover, dotTrace, and dotMemory.

Here’s how the new products relate to each other: ReSharper and ReSharper C++ are distinct products but ReSharper Ultimate unites them and adds other .NET tools:

How ReSharper, ReSharper C++ and ReSharper Ultimate relate

Why change anything?

There are two major reasons behind introducing these changes:

  • We wanted to get the positioning of ReSharper and .NET tools in sync with reality. For instance, isolating C# and VB.NET editions don’t make much sense anymore as ReSharper now supports over 10 programming languages. However separating C++ support from everything else does make sense as C++ and .NET applications are usually developed separately.
  • We wanted to streamline concurrent usage of ReSharper with other .NET tools. Traditionally, many customers have been hesitant to use dotTrace, dotMemory and dotCover alongside the widely popular ReSharper. This has happened for various reasons, notably those related to price and compatibility. For example, profilers would sometimes be seen as costing too much without being fully applicable in a day-to-day .NET developer workflow, and integrating all these tools in Visual Studio could increase memory consumption to intolerable levels. Both of these problems are now solved: one (price) with recent pricing changes and integrating .NET tools into the single-license ReSharper Ultimate product, the other (compatibility) with a considerable effort of getting all JetBrains .NET tools to reuse a shared set of libraries and thus drastically decreasing memory consumption when more than a single tool (for example, ReSharper and dotCover) is integrated in the same version of Visual Studio and used concurrently.

What is ReSharper Ultimate?

ReSharper Ultimate is introduced as the top-level product in the ReSharper product line that combines all individual tools for .NET developers that JetBrains produces, as well as ReSharper C++. After the release of ReSharper 9, ReSharper Ultimate will include:

  • ReSharper
  • ReSharper C++
  • dotMemory
  • dotTrace
  • dotCover

A ReSharper Ultimate license makes a single developer eligible to use all 5 products on a single developer workstation. You can install them all at once, or at any time you feel you need them, and use a single license key to activate any of them.

Purchasing licenses to separate products will also be possible. For example, if you don’t need ReSharper but you need dotCover, dotMemory or dotTrace, you will still be able to purchase them separately. However if you need more than two of these tools, and also if you need any of these tools and ReSharper, then ReSharper Ultimate would be the easier and most probably the cheaper way to go.

Why would I be interested in ReSharper Ultimate?

There are several reasons why purchasing ReSharper Ultimate licenses can be beneficial:

  • Using both .NET languages and C++. If a single developer uses Visual Studio to code both in C# (or VB.NET, or TypeScript, or other languages supported by ReSharper) and in C++, they would probably want to have ReSharper help out in both worlds. Purchasing both ReSharper and ReSharper C++ for this developer is an option but ReSharper Ultimate is priced roughly the same and additionally makes the developer eligible to use dotCover, dotTrace and dotMemory.
  • Easier procurement and license key management. As opposed to maintaining several sets of licenses to individual JetBrains .NET tools that could be subject to different licensing terms and require renewal at different dates, you get a single license key per developer that you don’t have to renew any more often than once a year.
  • Uniform maintenance. Traditionally, JetBrains .NET tools have distributed using different licensing schemes, which would introduce unnecessary confusion at times for customers with licenses to more than a single tool. To make things easier, ReSharper Ultimate always includes a 1-year subscription meaning you won’t have to monitor subscription expiration dates for every tool, but instead you can upgrade them all for free during a year after purchase date. As soon as the first year of free subscription expires, you can renew all covered products for one more year, in one go.
  • Price. ReSharper Ultimate pricing is crazy appealing. For example, if you’re a company from the US and you’re considering buying commercial licenses to all JetBrains .NET tools, here’s how much you’d have to shell out to buy them separately:

    $349 (ReSharper) + $229 (ReSharper C++) + $249 (dotMemory) + $249 (dotTrace) + $199 (dotCover) = $1275. This is way overboard, right?

    In contrast, a single ReSharper Ultimate license that qualifies a single developer for all these products is worth only $599, which is over 50% off the package! You’re essentially getting 5 JetBrains .NET tools for the price of 2.

What if I want my ReSharper to support both .NET languages and C++?

If this is the case, you have two options:

  • Purchase both ReSharper and ReSharper C++. For a company based in the US, two commercial licenses would cost $349 (ReSharper) + $229 (ReSharper C++) = $578.
  • Purchase ReSharper Ultimate. For a company based in the US, a single ReSharper Ultimate license would cost $599. This is just a tad more expensive than the combo of two ReSharper licenses suggested above, plus the Ultimate license would also make you eligible to use dotMemory, dotTrace and dotCover.

ReSharper C++ release however is going to be delayed

While ReSharper 9 and updates to other .NET tools are expected to be released in early December, ReSharper C++ will not reach release quality by this time and will only be available as Beta. The ReSharper C++ team expects to deliver the final release in early 2015.

Therefore if you’re looking to purchase a license to ReSharper C++, you have the option to either hold off until the final release of ReSharper C++ (and use the free Beta before it goes live) or purchase ReSharper Ultimate that will cover ReSharper C++ as soon as the latter goes live.

You’ll be able to use the free ReSharper C++ Beta in any case, the choice goes down to spending money earlier (by purchasing ReSharper Ultimate) or later (by purchasing a ReSharper C++ license as soon as it’s available for purchase.)

Upgrades and renewals

Will I be able to upgrade my existing ReSharper Full/C#/VB.NET license to ReSharper 9?

Sure. If you have a license without free upgrade subscription or with an expired free upgrade subscription, this would be a paid upgrade.

However if you have a ReSharper C#, VB.NET or Full Edition license with a free upgrade subscription that is active by the time of ReSharper 9 release, you’ll be able to upgrade to ReSharper 9 for free.

Will I be able to upgrade my existing ReSharper Full/C#/VB.NET Edition license to ReSharper 9 Ultimate?

Yes, you can upgrade to ReSharper Ultimate from your current license at any time for an upgrade fee.

Will I be able to upgrade my existing dotTrace/dotCover/dotMemory license to ReSharper Ultimate?

No, there’s no explicit way to upgrade existing dotTrace (formerly dotTrace Performance), dotMemory (formerly dotTrace Memory) or dotCover licenses to ReSharper Ultimate as we don’t anticipate high demand on this upgrade path. If real demand proves us wrong, we’ll reconsider and find a solution.

For how long will I receive free updates for the products covered by ReSharper Ultimate license?

Every ReSharper Ultimate license includes 1-year subscription to all updates across all tools that it includes. After your subscription expires you can continue using the latest installed versions of the tools, and you will be eligible to receive free bug-fix updates as well (those that have 3 digits in version number).

Please note that there are no traditional “per major version” licenses to ReSharper Ultimate: when you buy (or upgrade to) a ReSharper Ultimate license, you always receive 1 year of free upgrades.

Questions?

The considerable changes outlined above can be hard to understand, and communicating them is not an easy task as well. If you have any questions, please ask them in comments, and we’ll try our best to clarify.

ReSharper 9 hits Beta along with other JetBrains .NET tools

$
0
0

Enough of early access to the family of .NET tools, it’s time for serious business!

Please welcome Beta releases of ReSharper 9.0, ReSharper C++, dotCover 3.0, dotTrace 6.0, dotMemory 4.2 and dotPeek 1.3.

As all of them are now available from a single installer, you can download ReSharper 9 Beta and choose to install only ReSharper or more of our .NET tools.

Read on for a recap of new functionality, the recommended way to submit feedback, and the list of major known issues.

Common installer for Beta builds of ReSharper 9 and other .NET tools

A recap of what’s new in these releases

  • ReSharper 9.0 Beta integrates into Visual Studio 2015 Preview, provides initial support for C#6.0, embeds a new Go To Action option into the Alt+Enter shortcut, introduces support for regular expressions, adds type dependency diagrams, brings more bulk quick-fixes and import actions. Client-side languages get a special treatment with 50+ new JavaScript and TypeScript quick-fixes, as well as 270 new code inspections.
  • ReSharper C++ Beta is, well, the first Beta release of a new product. The current state of C++ support in ReSharper is described here.
  • dotCover 3.0 Beta receives remote code coverage, a restyled coverage configuration dialog, a new coverage controller, as well as support for ReSharper 9 and Visual Studio 2015 Preview.
  • dotTrace 6.0 Beta introduces a completely new Timeline profiling mode for collecting temporal call stack and thread state data, refines the starting point of the profiling process with dotTrace Home view, adds more flexibility to subsystems, and supports Visual Studio 2015 Preview.
  • dotMemory 4.2 Beta learns to live on a shared platform with the other .NET tools, and therefore receives Visual Studio 2015 Preview support as well.
  • dotPeek 1.3 Beta borrows a set of actions introduced in ReSharper 9, and integrates its symbol server with ReSharper’s navigation to external sources, which basically allows setting break points in third-party code that you navigate to using ReSharper.

Note that all JetBrains .NET tools now operate on a shared platform, which conserves resources when several products are running at the same time in Visual Studio.

We need your feedback as soon as possible

If you have ignored prior Early Access builds expecting to preview ReSharper and friends on a later stage, this is probably the time for you to give the updates a try. As we are on a very tight release schedule this time, we ask you to check the known issues outlined below, and if your system environment is fine, download and install the Beta releases. When you have them installed, if anything is not working, please let us know about any critical issues as soon as possible.

If anything is going wrong, the easiest way to let us know is select ReSharper | Help | Report a Bug or Submit Feedback. In the Feedback Center window that opens, you’ll be able to briefly describe the problem you’re having, and send additional info our way: from environment information to a screenshot of your Visual Studio window to a settings file or a snapshot of your solution’s structure.

Reporting feedback on ReSharper and other JetBrains .NET tools  from Visual Studio

Beware of known issues

Some things are certain to go wrong. We know them, and you should know them, too. Here are major known issues of this Beta release:

  • Running any product under Windows with a non-English locale leads to a Visual Studio crash.
  • Integration with Visual Studio 2005 and 2008 is not supported. In fact, as announced recently, support for these versions of Visual Studio is discontinued permanently. We just thought it wouldn’t hurt to reiterate this.
  • The installer only runs on 64-bit operating systems.
  • The Beta releases don’t currently support Windows XP.
  • Standalone applications (dotTrace, dotMemory and dotPeek) don’t launch under Windows Vista.

Are you ready?

Are you not affected by the known issues outlined above? Congratulations! Download the Beta installer and give it a ride!

ReSharper 9 is Released along with dotTrace 6, dotCover 3, dotMemory 4.2 and dotPeek 1.3

$
0
0

Great news from the .NET tools development team here at JetBrains: ReSharper 9.0, dotCover 3.0, dotTrace 6.0, dotMemory 4.2 and dotPeek 1.3 are all released and available for download!

As all JetBrains .NET tools now use a single installer, you can download ReSharper 9 and choose to install only ReSharper or more of our .NET tools.

Resharper 9 is released

Highlights of ReSharper 9.0 RTM include:

  • Support for Visual Studio 2015 Preview while preserving compatibility with Visual Studio 2010, 2012 and 2013. Support for VS 2005 and 2008 has been discontinued, as described before.
  • Support for C# 6.0. Although the final C# 6.0 language design is not yet clear enough, ReSharper 9.0 already provides support for most of what is defined. New code suggestions help migrate your existing code to more concise C# 6.0 language constructs such as the conditional access operator (?.) and the long-awaited get-only auto-properties. You can get rid of curly braces with expression-bodied members, implement better DSLs using static support, play with exception filters and dictionary initializers. Please check this post for more details on C# 6.0 support.
  • New navigation features including Go to Action to search for a particular action using the legendary Alt+Enter shortcut and Navigate to Exposing APIs option for finding all the methods that are capable of returning a particular type.
  • Regular Expressions support with code completion for wildcards and regular expression groups, error highlighting, quick-fixes and a separate Regular Expression Validation Utility. Blog post about Regular Expressions support in ReSharper 9.0.
  • Fix in Scope improvements to remove redundant qualifiers, fix naming or remove regions in the scope of the whole solution. ReSharper 9.0 can look through the code in your solution and generate the appropriate imports for all the types including extension methods.
  • Type Dependencies Diagram that looks cute and helps finding out what code depends on a particular type, and what the type itself depends on.
  • Outstanding JavaScript and TypeScript support with 50+ new quick-fixes to cover over 270 different types of code issues, new live templates for common TypeScript entities, and new code generation options. The list of available refactorings is extended to include Introduce Field, Rename File, Copy type and a set of Move refactorings to ease code tweaking.

ReSharper C++ has not reached the release yet, the EAP goes on. Stay tuned for further updates!

Updates to other .NET tools

We’re also rolling out substantial updates across the whole family of JetBrains tools for .NET professionals:

  • dotTrace 6.0 introduces a completely new Timeline profiling mode for collecting temporal call stack and thread state data, refines the starting point of the profiling process with dotTrace Home view, adds more flexibility to subsystems, and supports Visual Studio 2015 Preview.
  • dotCover 3.0 supports remote code coverage, gets a restyled coverage configuration dialog, a new coverage controller and support for ReSharper 9 and Visual Studio 2015 Preview.
  • dotMemory 4.2 learns to live on a shared platform with the other .NET tools, and therefore receives Visual Studio 2015 Preview support as well.
  • dotPeek 1.3 borrows a set of actions introduced in ReSharper 9, and integrates its symbol server with ReSharper’s navigation to external sources, which basically allows setting break points in third-party code that you navigate to using ReSharper.

All JetBrains tools for .NET professionals now operate on a shared platform which means less consumption of resources when running them at the same time in Visual Studio.

Moreover, with the new ReSharper Ultimate license you can now use all of them at affordable price that includes 1 year of free upgrade subscription.

What’s new: Live sessions

If you’re interested to learn more about the new releases, read all blog posts about ReSharper 9 (there’s more of them to come soon), or register for our free webinars:

Whatever anyone can say, the best way to learn more about these updates to JetBrains .NET tools is to download a trial and test it in action!

String Interning: Effective Memory Management with dotMemory

$
0
0

Starting with version 4.1, dotMemory offers the String duplicates inspection. The idea behind it is quite simple: it automatically checks memory for string objects with the same value. After you open a memory snapshot, you will see the list of such strings:

String duplicates inspection in dotMemory

How can this help? Well, string duplicates possibly indicate ineffective memory usage. Why create a new string if it is already in memory?

Imagine, for example, that in the background your app parses some text files with repetitive content (say, some XML logs).

Code example for log file processing

So, dotMemory finds a lot of strings with identical content. What can we do?

Inspection results for the example

The obvious answer – rewrite our app so that it allocates strings with unique content just once. Actually, there are at least two ways this can be done. The first one is to use the string interning mechanism provided by .NET.

CLR Intern Pool

.NET automatically performs string interning for all string literals. This is done by means of an intern pool – a special table that stores references to all unique strings. But why  aren’t the strings in our example interned? The thing is that only explicitly declared string literals are interned on the compile stage. The strings created at runtime are not checked for being already added to the pool. For example:

Interning example

Of course, you can circumvent this limitation by working with the intern pool directly. For this purpose, .NET offers two methods: String.Intern and String.IsInterned. If the string value passed to String.Intern is already in the pool, the method returns the reference to the string. Otherwise, the method adds the string to the pool and returns the reference to it. If you want to just check if a string is already interned, you should use the String.IsInterned method. It returns the reference to the string if its value is in the pool, or null of it isn’t.

Thus, the fix for our log parsing algorithm could look as follows:

CLR interning example

Further memory profiling will show that strings are successfully interned.

Inspection after the fix

Nevertheless, such an implementation has one rather serious disadvantage – the interned strings will stay in memory “forever” (or, to be more correct, they will persist for the lifetime of AppDomain, as the intern pool will store references to the strings even if they are no longer needed).

If, for example, our app has to parse a large number of different log files, this could be a problem. In such a case, a better solution would be to create a local analogue of the intern pool.

Local Intern Pool

The simplest (though very far from optimal) implementation might look like this:

Local pool code example

The processing algorithm will change a little bit as well:

Local pool example

In this case, pool will be removed from memory with the next garbage collection after ProcessLogFile is done working.

Thanks for reading! We hope this post was helpful. If you want to try dotMemory and the full set of its automatic inspections on your code, just download your free 5-day trial here.

Unit Testing and Memory Profiling: Can They Be Combined?

$
0
0

Memory profilers can hardly be called an “everyday tool.” Typically, developers start thinking about profiling their product closer to its release. This approach may work fine until some last-minute issue like a leak or huge memory traffic crushes all your deadlines. The proactive approach would be to profile your app’s functionality on a daily basis, but who’s got the resources to do that? Well, we think there may be a solution.

If you employ unit testing in your development process, it is likely that you regularly run a number of tests on app logic. Now imagine that you can write some special “memory profiling” tests, e.g. a test that identifies leaks by checking memory for objects of particular type, or a test that tracks memory traffic and fails in case the traffic exceeds some threshold. This is exactly what dotMemory Unit framework allows you to do. The framework is distributed as a NuGet package and can be used to perform the following scenarios:

  • Checking memory for  objects of a certain type.

  • Checking memory traffic.

  • Getting the difference between memory snapshots.

  • Saving memory snapshots for further investigation in dotMemory (a standalone .NET memory profiler from JetBrains).

In other words, dotMemory Unit extends your unit testing framework with the functionality of a memory profiler.

IMPORTANT: dotMemory Unit is currently in the EAP (Early Access Program) stage. Please use it for evaluation purposes only!

How It Works

  • dotMemory Unit is distributed as a NuGet package installed to your test project:
    PM> Install-Package JetBrains.DotMemoryUnit -pre

  • dotMemory Unit requires ReSharper unit test runner. To run tests that use dotMemory Unit, you should have either dotCover 3.1 EAP or ReSharper 9.1 EAP05 installed on your system.

  • After you install the dotMemory Unit package, ReSharper’s menus for unit tests will include an additional item, Run Unit Tests under dotMemory Unit. In this mode, the test runner will execute dotMemory Unit calls as well as ordinary test logic. If you run a test the ‘normal’ way (without dotMemory Unit support), all dotMemory Unit calls will be ignored.

    Unit Tests Menu

  • dotMemory Unit works with all of the unit-testing frameworks supported by ReSharper’s unit test runner including MSTest and NUnit.

  • A standalone launcher for integrating with CI systems like JetBrains TeamCity is planned for future releases.

Now let’s take a look at some examples to better understand what dotMemory Unit does.

Example 1: Checking for Specific Objects

Let’s start with something simple. One of the most useful cases can be finding a leak by checking memory for objects of a specific type.

GetObjects Assertion

  1. A lambda is passed to the Check method of the static dotMemory class. This method will be called only in case you run the test using Run test under dotMemory Unit.

  2. The memory object passed to the lambda contains all memory data for the current execution point.

  3. The GetObjects method returns a set of objects that match the condition passed in another lambda. This line slices the memory by leaving only objects of the Foo type. The Assert expression asserts that there should be 0 objects of the Foo type.
    Note that dotMemory Unit does not force you to use any specific Assert syntax. Simply use the syntax of the framework your test is written for. For example, the line in the example uses NUnit syntax but could be easily updated for MSTest:
    MSTest Assertion

With dotMemory Unit you can select a set of objects by almost any condition, get the number of objects in this set and their size, and use these data in your assertions.
In the following example, we check for objects in the large object heap:

Checking for Specific Objects


Example 2: Checking Memory Traffic

The test for checking memory traffic is even simpler. All you need do to is mark the test with the AssertTraffic attribute. In the example below, we assert that the amount of memory allocated by all the code in TestMethod1 does not exceed 1,000 bytes.

AssertTraffic Attribute Example

Example 3: Complex Scenarios for Checking Memory Traffic

If you need to get more complex information about memory traffic (say, check for traffic of objects of a particular type during some specific time interval), you can use a similar approach to the one from the first example. The lambdas passed to the dotMemory.Check method slice and dice traffic data by various conditions.

Check Traffic with Traffic Type

  1. To mark time intervals where memory traffic can be analyzed, use checkpoints created by dotMemory.Check (as you probably guessed, this method simply takes a memory snapshot).

  2. The checkpoint that defines the starting point of the interval is passed to the GetTrafficFrom method.
    For example, this line asserts that the total size of objects implementing the IFoo interface created in the interval between memoryCheckPoint1 and memoryCheckPoint2 is less than 1,000 bytes.

  3. You can get traffic data for any checkpoint that was set earlier. Thus, this line gets traffic between the current dotMemory.Check call and memoryCheckPoint2.

Example 4: Comparing Snapshots

Like in the ‘standalone’ dotMemory profiler, you can use checkpoints not only to compare traffic but for all kinds of snapshot comparisons. In the example below we assert that no objects from the MyApp namespace survived garbage collection in the interval between memoryCheckPoint1 and the second dotMemory.Check call.

Compare Snapshots

Conclusion

dotMemory Unit is very flexible and allows you to check almost any aspect of app memory usage. Use “memory” tests in the same way as unit tests on app logic:

  • After you manually find an issue (such as a leak), write a memory test that covers it.

  • Write tests for proactive testing – to ensure that new product features do not create any memory issues, like objects left in memory or large traffic.

Thanks for reading and don’t hesitate to try dotMemory Unit EAP on your own! It’s absolutely free, and the only requirement is ReSharper or dotCover installed on your machine.


Exploring .NET Core with ReSharper Ultimate

$
0
0

We recently started the EAP for ReSharper 9.1, and it might have been easy to miss that the EAP is not just for ReSharper, but for ReSharper Ultimate – that is, our entire .NET tools product range. Starting with ReSharper 9.0, we unified the way we both build and distribute our .NET tools, so that they share a common install. This has many benefits, from licensing to sharing in-memory caches between products. So not only is it the ReSharper 9.1 EAP, but it’s the EAP for dotCover 3.1, dotTrace 6.1, dotMemory 4.3 and dotPeek 1.4.

With EAP03, we’re introducing support for .NET Core to ReSharper Ultimate. This means you can get code coverage and performance and memory profiling for your .NET Core apps.

But let’s back up. What’s .NET Core?

This is Microsoft’s new, Open Source, cross platform .NET stack. It is the next generation of .NET, designed to replace the need for Portable Class Libraries by providing a common, modular .NET implementation across all platforms, including ASP.NET vNext. (One slightly confusing part is that it doesn’t replace the .NET Framework. This will still be Microsoft’s .NET stack on the Windows desktop, and will remain in use, and supported for both compatibility reasons and to support desktop apps, such as WPF.)

It’s made up of a couple of pieces – the CoreCLR project is the runtime, containing the JIT and the Garbage Collector, and the Base Class Library is being reimplemented in the CoreFX project.

One of the nice things about a .NET Core application is that it is xcopy deployable. That is, .NET Core apps don’t require an install, or a GAC, or anything. All of the files required to run an application can live in a single folder.

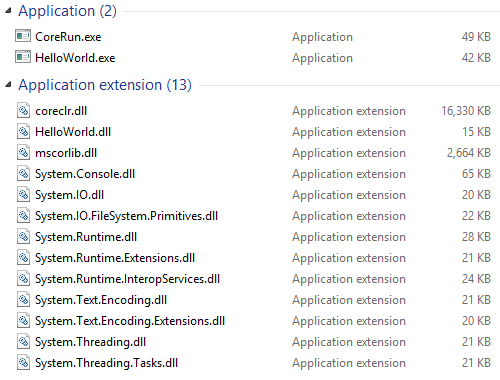
Explorer showing the files in the HelloWorld sample

This test application is the HelloWorld app from the CoreFX Lab repo. As we can see, the folder contains everything we need to run the application. The BCL System assemblies are present, perhaps a few more than you’re used to on the desktop – this allows for a more modular distribution of the BCL, only distributing the assemblies you use. You can also see mscorlib.dll, which provides the primitive types, such as Object and String, and coreclr.dll, which is the actual runtime, including the JIT and the garbage collector. Most interestingly, we have three other files – HelloWorld.dll, CoreRun.exe and HelloWorld.exe.

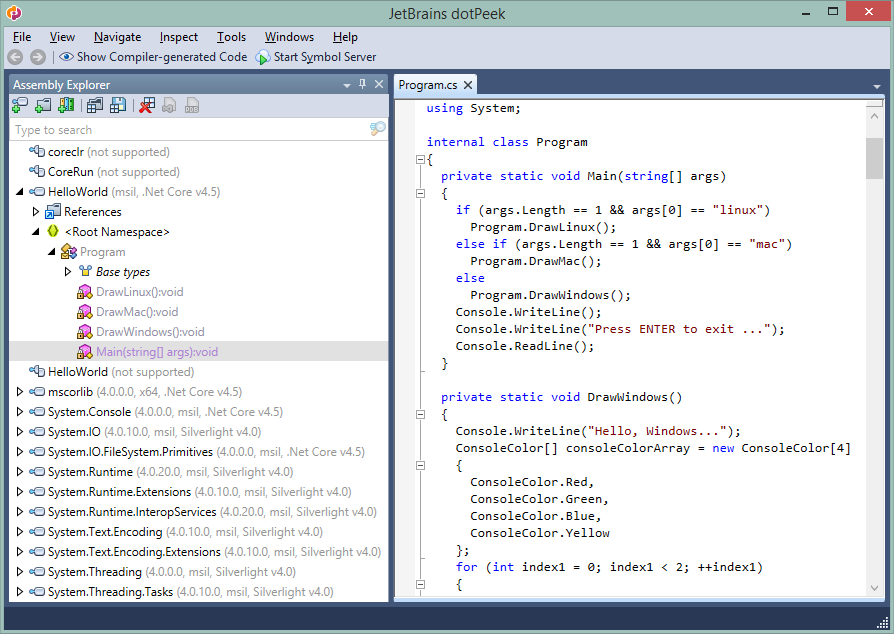
dotPeek showing decompiled code

If we take a look at these files in dotPeek, we can see that the System assemblies and HelloWorld.dll are just normal looking assemblies, although they’re now targeting .NET Core v4.5, rather than the .NET Framework. Furthermore, we can see that HelloWorld.dll contains our Program class, with a normal static Main method – this is the entry point to the application. And coreclr is listed as “not supported”, as we know that’s a dll containing the native code for the runtime itself.

So what are HelloWorld.exe and CoreRun.exe?

These files are also coming up as “not supported” in dotPeek, and if we look at the their file sizes, we see that they’re both very small, only about 40Kb each. These files are native stubs, and are used to bootstrap the .NET Core runtime and launch the .NET application. The stub will load coreclr.dll, initialize the runtime and point it to the managed code to run.

The CoreRun.exe process is a generic launcher that requires the HelloWorld.dll to be passed in as a command line parameter, and provides extra command line parsing to enable attaching a debugger, and providing verbose output. The HelloWorld.exe process is simpler, and requires no command line parameters, automatically launching HelloWorld.dll and passing any command line parameters to the .NET application.

These stubs are required for .NET Core primarily to allow for running cross platform. Traditional .NET Framework applications combine the bootstrap stub and the .NET application code and metadata (HelloWorld.dll) so the .NET application just works transparently (in fact, versions of Windows later than Windows XP recognize .NET applications at the Operating System level, and bootstrap the .NET Framework automatically). But if we want to run the HelloWorld .NET application on OS X or Linux, then we can’t just run HelloWorld.exe – other operating systems don’t know how to launch .exe files, and might not even be Intel-based! So on other operating systems, the stub can be replaced with another executable, without having to replace the .NET application.

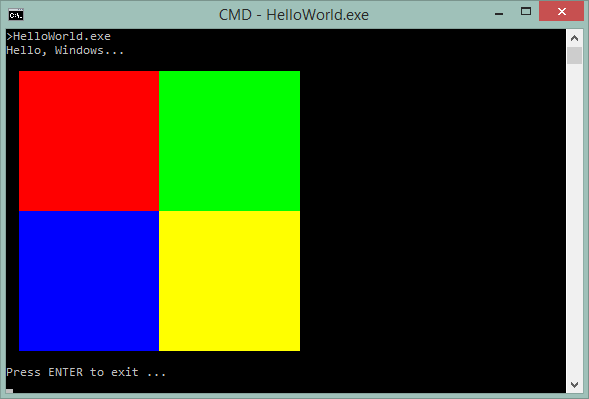
Image of HelloWorld console application running

We can dive deeper into .NET Core applications, by profiling and analyzing them at runtime.

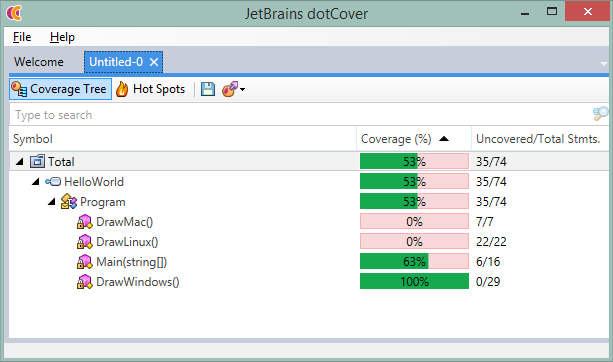
We can use dotCover to provide code coverage – note that DrawWindows is being called, but not DrawLinux or DrawMac. (While .NET Core is cross-platform, ReSharper Ultimate is a set of .NET Framework applications, using WPF, and as such, tied to Windows.)

dotCover showing coverage for the HelloWorld application

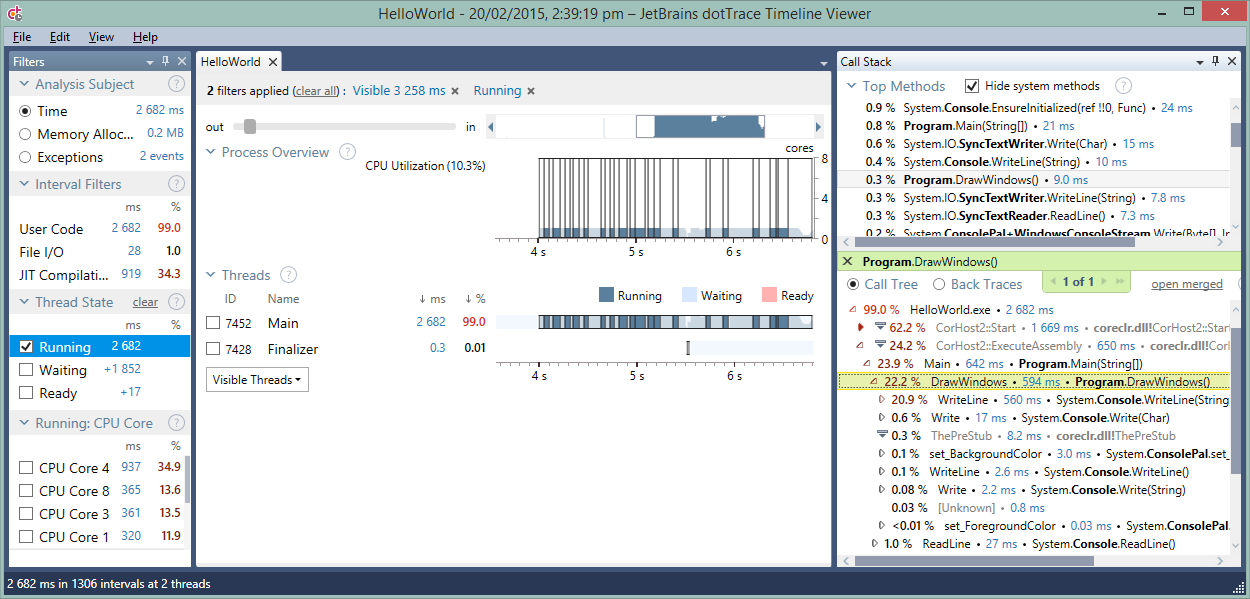
Performance profiling is handled by dotTrace, which can provide a nice timeline view of the performance of a .NET Core application, with powerful filtering capabilities to filter based on CPU, CPU state, thread and so on. Hopefully you’ll be working on slightly more interesting applications!

dotTrace showing performance information about HelloWorld application

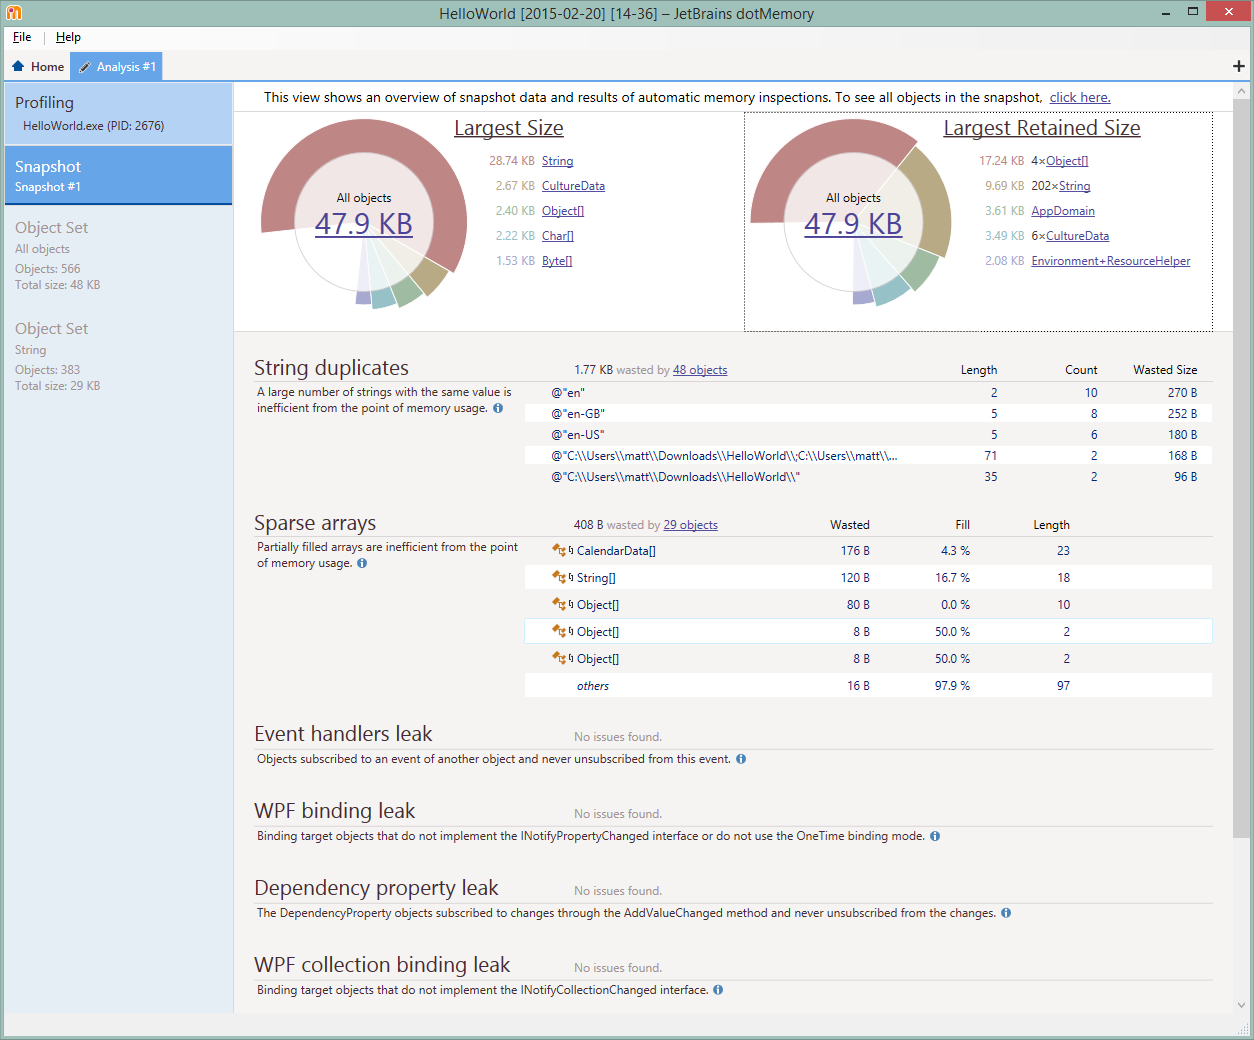
And finally, dotMemory will allow you to examine the memory allocations of .NET Core apps, too.

dotMemory analysing memory snapshot of HelloWorld application

All of this support for .NET Core is handled transparently by ReSharper Ultimate. You simply need to start profiling or coverage for a .NET application, passing in either of the stubs as the startup application, and ReSharper Ultimate will do the rest.

Also, this is initial support. There are a few things that aren’t working correctly just now, but we’re working on them, and they should be fixed in future EAP builds.

Grab yourself a copy of the latest EAP and give it a go. There’s more to come. Stay tuned!

Analyzing ineffective memory usage with dotMemory

$
0
0

Memory issues in .NET apps can be generally divided into 1) leaks, 2) large memory traffic, and 3) ineffective memory usage. In this blog we’ve written extensively about how dotMemory helps you deal with the first two problems. Now it’s time to talk about analyzing ineffective memory usage, especially since dotMemory 4.3 introduces a new feature that can help really fight this issue.

Before we move on, let’s agree on some terms. What is ineffective usage? When your app consumes more memory than it should, or could, we call this ineffective. Sometimes you just “feel” that a particular algorithm consumes too much, but nothing seems to explain why it does. That’s when you should use a memory profiler.

Assume you’ve done the profiling and taken a memory snapshot. What next?

There are two main analysis approaches that may be combined or used independently. Start by answering the following two questions:

  • What methods allocate the most memory?

  • What objects retain the most memory?

What Methods Allocate Most of the Memory?

This task is typically solved with the help of a call tree. Most memory profilers have a special call tree view for determining the calls that allocated the largest amounts of memory. Doesn’t sound too complicated, does it? But in fact, even for mid-size projects digging into the tree may become a headache.

Call Tree

Of course, this algorithm is applicable to dotMemory as well. However, since version 4.0 we offer a much easier way called Call Tree as Icicle Chart.

The idea behind the chart is simple – it’s a graphical representation of the call tree. Each call is shown as a horizontal bar whose length depends on the size of objects allocated in the call’s subtree. The more memory allocated in the underlying subtree, the longer the bar. The bar’s color value serves as an additional indicator – the more memory allocated by the call itself, the darker the bar.

Call Tree Icicle Chart

So instead of looking at lots of numbers, start your analysis by opening the Call Tree as Icicle Chart view. In just a glance you can match a certain call with the amount of memory it allocates.

For example, the following chart shows the same data as the Call Tree table in the GIF above. Notice how there’s no need to dive into the call tree: main memory allocations can be seen instantly.

Icicle Chart Example

Of course the chart is interactive: just click a call to see its call stack. Use the Shift+click combination to zoom into the chart and examine the call chain in more detail.

Icicle Chart

Who Retains the Memory?

Understanding how memory is retained in your app is essential for successful optimization. For example, you know that a major part of memory in your app is consumed by strings. Nevertheless, most likely, the subject of your optimizations is not these strings by themselves but the data structures that store them. That’s why “Who retains the memory?” is the next big question when analyzing ineffective memory usage.

Objects that exclusively retain other objects in memory are called dominators. Earlier dotMemory versions offered just one way of analyzing app dominators – the Group by Dominators view, which shows the tree of dominators sorted by retained memory size:

Group By Dominators View

Since version 4.3, dotMemory offers a new “visual” way of analyzing dominators: the Sunburst Chart. In this view, the dominators hierarchy is shown on a sunburst chart. The more memory a dominator retains, the larger the central angle.

Dominators Chart

A quick look at this chart shows what objects are crucial for your app and helps you evaluate the largest structures.

Sunburst Chart

If you click on a particular dominator, the Domination Path on the right will show you the retention path of this dominator. Double-click on a dominator to zoom into the chart and see the objects retained by this dominator in more detail.

Our experience shows that Dominators chart is also very effective when you need to quickly evaluate how a certain functionality works in your app. For example, below are two charts built for an image editor application: the first one was plotted before anything is done in the app, and the second one reflects memory usage after the user has applied an image filter.

Example of Two Dominators Charts

After some time, if you profile your app constantly, you’ll even be able to “see” not only how your app works, but even how particular changes in code affect memory usage.

Thanks for reading! We hope this post was helpful. Give dotMemory 4.3 a try and explore the Dominators and Call Tree charts.

Memory Testing on a CI Server. dotMemory Unit Standalone Launcher

$
0
0

After we announced the dotMemory Unit framework, the most frequently asked question was, “When will the standalone launcher for CI be available?” Finally, the time has come! Along with dotMemory 4.4, we have also released dotMemory Unit 2.0 which contains not only a lot of improvements but also the dotMemoryUnit.exe tool.

The tool (distributed as a zip archive*) works as a mediator: it runs a particular standalone unit test runner under a profiler and provides support for dotMemory Unit calls in the running tests.

*Important! If your domain policy is to treat files from the Internet as unsafe, don’t forget to unblock the zip file by clicking the Unblock button in file properties.

For example, this is how you can run NUnit tests from some MainTests.dll file:
dotMemoryUnit.exe
-targetExecutable="C:\NUnit 2.6.4\bin\nunit-console.exe"
-returnTargetExitCode --"E:\MyProject\bin\Release\MainTests.dll"

Here:

  • -targetExecutable is the path to the unit test runner that will run tests.
  • -returnTargetExitCode makes the launcher return the unit test runner’s exit code. This is important for CI as the build step must fail if any memory tests fail (test runners return a nonzero exit code in this case).
  • The parameters passed after the double dash (--) are unit test runner arguments (in our case it’s a path to the dll with tests).

Now, it’s easier than ever to make memory tests a part of your continuous integration builds. Simply add the command shown above as a build step on your CI server, and it will run your tests with the dotMemory Unit support.

For example, this is how the build log of a failed step looks like in TeamCity:

dotMemory Unit launcher output

However, if you’re a TeamCity user, we can offer a much more convenient solution.

Integration with TeamCity

Along with dotMemory Unit 2.0, we release the plugin for TeamCity that adds support for dotMemory Unit to all .NET test runner types. Let’s take a more detailed look at how this works.

TIP! If you want to take a look at a working example, here is a sample build project on our public TeamCity server. Project build configuration is available at this link.

  1. On your TeamCity server, copy dotMemoryUnit.zip (get the latest version from Artifacts on JetBrains build server) to the plugins directory located in your TeamCity data directory.
  2. Restart the TeamCity Server service.
    Now, all .NET test runners in TeamCity provide support for dotMemory Unit.
  3. As the dotMemory Unit standalone launcher is required for the plugin to work, you should provide it to your build agent. There are two ways to do this:
    • Download and unzip the launcher to any directory on a TeamCity build agent. Don’t forget to Unblock the zip!
    • [Recommended] Use the launcher from the dotMemory Unit NuGet package referenced by your project.
      Note that if you omit binaries from the source control repository, you can use TeamCity’s NuGet Installer runner type. It will perform NuGet Package Restore before the build. All you need is to add the NuGet Installer “build step” and specify the path to your solution.
      NuGet Installer Step
  4. Now, update the step used to run tests in your build configuration. Open the corresponding build step in your build configuration:
    TeamCity Unit Test Build Step
  5. Note that after we installed the dotMemoryUnit plugin, this build step now additionally contains the JetBrains dotMemory Unit section. Here you should:
    • Turn on Run build step under JetBrains dotMemory Unit.
    • Specify the path to the dotMemory Unit standalone launcher directory in Path to dotMemory Unit. Note that as we decided to use the launcher from the NuGet referenced by our project (see step 3), we specify the path relative to the project checkout directory.
    • In Memory snapshots artifacts path, specify a path to the directory (relative to the build artifacts directory) where dotMemory Unit will store snapshots in case memory test(s) fail.

    dotMemory Unit support

  6. Save the configuration.

Done! Now, this build step supports tests that use dotMemory Unit.

From the point of the end-user, nothing has changed. If you run the configuration and any of the memory tests fails, the results will be shown in the overview:
TeamCity failed build overview

The Tests tab will show you the exact tests that have failed. For example, here the reason had to do with the amount of memory traffic:TeamCity Tests Tab

Click on a failed test to see exactly was has gone wrong:
TeamCity test result

Now, you can investigate the issue more thoroughly by analyzing a memory snapshot that is saved in build artifacts:

Build Artifacts - Memory Snapshot

Note that to open memory snapshots, you will need a standalone dotMemory (or ReSharper Ultimate) installation.

Snapshot in dotMemory

Additional Benefits

If you’ve used dotMemory Unit before, you probably know that it required ReSharper unit test runner to work. Since v2.0, you can also run tests via dotMemory Unit’s standalone launcher and the list of supported unit testing frameworks has expanded to include:

  • MSTest*
  • NUnit*
  • XUnit
  • MBUnit
  • csUnit

*Can also be run from Visual Studio with ReSharper

Nevertheless, if your unit testing framework is missing from this list (e.g., MSpec), you can still use it with dotMemory Unit.

All you need to do is tell dotMemory Unit where your test method starts and where it ends. This is done with two methods: DotMemoryUnitController.TestStart() and DotMemoryUnitController.TestEnd().

We recommend that you create an IDisposable class that uses these methods, and then wrap the code in your tests with the using statement that creates an instance of this class:

class DotMemoryUnit: IDisposable
{
   public static IDisposable Support{get{return new DotMemoryUnit();}}
   private DotMemoryUnit()
   {
       DotMemoryUnitController.TestStart();
    }

   public void Dispose()
   {
      DotMemoryUnitController.TestEnd();
   }
}

public class Tests
{
   [Test]
   public void TestMethod1()
   {
      using (DotMemoryUnit.Support)
      {
         ... // your code goes here
      }
   }
}

That’s it! Now you can run tests wrapped in this way using dotMemory Unit standalone launcher or Visual Studio with ReSharper (in case it has the extension for the unit testing framework you use). Simply copy & paste the code above and reuse it in your project. You can also find this code on github.

With this new feature, dotMemory Unit becomes very flexible: you can use it not only to add support for a unit testing framework, but also to extend and adapt dotMemory Unit to your specific needs. For example, see how we added support for MSpec.

Thanks for reading! As always we recommend that you try dotMemory Unit on your own. If you’re already using it, then probably automating your tests on a CI server is the next logical step.

Taking Memory Snapshots by Condition in dotMemory 4.4

$
0
0

While dotMemory 4.4 is primarily focused on dotMemory Unit 2.0, it also brings a number of useful updates. One such improvement is the ability to take memory snapshots only when a certain condition occurs. The most common use case for this is taking a snapshot when the memory consumption in your application increases dramatically. As catching the moment manually (using the Get Snapshot button) may be quite tricky, dotMemory 4.4 allows you to automate the process.

All you need to do is set a particular condition, such as:

  • Memory consumption increase in MB
  • Memory consumption increase in %
  • Period of time in minutes (periodical taking of snapshots)

After the condition occurs, the snapshot will be collected automatically.

For example, let’s say we have a web application that allocates a huge amount of memory after some actions (but we’re not sure of their exact sequence). What is the root cause? Is this some ineffective algorithm or just IIS that reserves memory for hard times? In this case, the best solution is to attach dotMemory to the app pool that runs the application and take a memory snapshot when memory consumption surges. As we don’t want to spend all day waiting for this moment, we will add the condition on taking the snapshot.

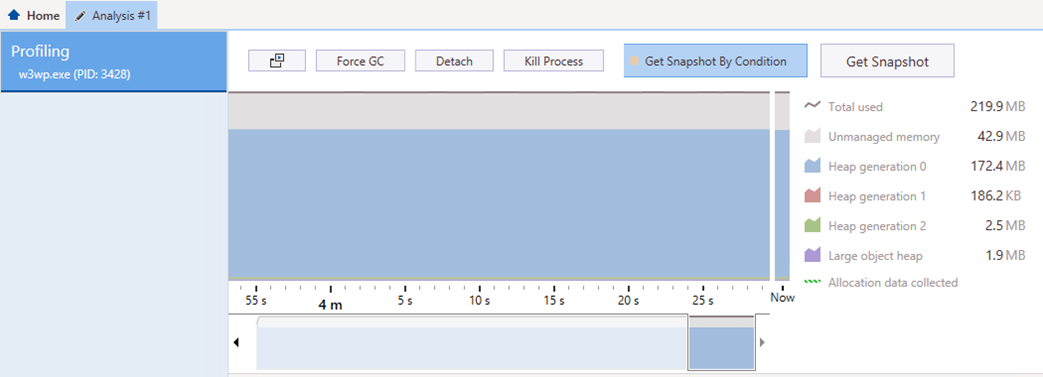
  1. Attach dotMemory to the corresponding app pool (w3wp.exe process).
  2. As soon as the session starts, click Get Snapshot By Condition.
    Profiling session
  3. In the Get Snapshot by Condition window, specify the condition for taking a snapshot. In our case, we will take snapshot if memory consumption increases by 100 MB. The maximum number of snapshots that can be taken automatically is set by the Limit the max number of snapshots to parameter.
    Get Snapshot by Condition window
    That’s it! As soon as we click Start, dotMemory will track overall application memory usage. When it exceeds the current value (taken at the time of clicking Start) by 100 MB, dotMemory will take a snapshot, all on its own!

Getting snapshots by condition is enabled

Note that, as soon as the defined condition occurs, the memory consumption at that moment becomes the new baseline.

You can try this feature if you’re using dotMemory 4.4 or later (as a separate product or as part of ReSharper Ultimate).

Details on dotTrace, dotCover, dotMemory licensing changes

$
0
0

tl;dr

  1. Starting November 2, dotTrace, dotCover and dotMemory will only be licensed as part of ReSharper Ultimate
  2. If you’re not licensed to dotTrace, dotCover and/or dotMemory, you can safely ignore this post
  3. There are reasons behind this change
  4. To figure out what this change means to you and compare your license maintenance costs before and after the licensing change, locate yourself in one of 4 major affected groups of customers
  5. If you’re only using dotCover on a CI server, take note that we’re preparing a free license to dotCover Command Line Tools

What’s going on?

Subscriptions

As you most probably know, last month we at JetBrains have announced a forthcoming transition to subscription licensing, which is due to occur on November 2, 2015.

The change directly affects users of ReSharper, ReSharper C++, dotTrace, dotMemory and dotCover: all licenses purchased on or after November 2, 2015 will be subscriptions, with monthly and yearly billing options available. Substantial discounts are provided to convert existing licenses to the new scheme, and a new licensing option is introduced that will allow you to subscribe to all desktop products that JetBrains offers, which includes IntelliJ IDEA and its sister IDEs, as well as the entire ReSharper Ultimate product line.

For a summary of subscription licensing and pricing, please see jetbrains.com/toolbox.

dotTrace, dotCover, dotMemory will no longer be licensed separately

However there’s even more change coming for customers who use JetBrains .NET tools. We have made this public on the day we revealed the subscription model but this might have been lost in the overall fuss created by the announcement. This is why we’d like to emphasize specifically that starting November 2, 2015, dotCover, dotTrace and dotMemory will only be available for purchase as part of ReSharper Ultimate subscriptions: separate licensing of dotCover, dotTrace and dotMemory will be discontinued.

Summary of licensing changes

Why are dotCover, dotTrace and dotMemory not going to be licensed separately after November 2, 2015?

This is simple and long time coming: in most cases, dotCover, dotTrace and dotMemory are purchased and used along with ReSharper.

Well aware of this trend already a year ago, we have introduced a ReSharper Ultimate license, and we’ve seen a strong conversion from separate licenses to ReSharper Ultimate licenses as a result, especially on the personal side.

Another factor is the growing trend to integrate ReSharper Ultimate products more closely than before, in many respects. Starting from ReSharper 9.0, we have reworked ReSharper, dotCover, dotTrace, dotMemory and ReSharper C++ so that they could share a common set of assemblies while loaded in Visual Studio, which helped drastically reduce their cumulative memory footprint and in many cases actually made their concurrent usage in Visual Studio feasible. However, this change also meant there would only be a single set of compatible tools that you could use in Visual Studio alongside each other, which, in turn, prompted us to release updates to the entire ReSharper Ultimate family in a simultaneous manner.

Going forward, the plan is to make ReSharper Ultimate tools even more interconnected in ways that would move runtime analysis that dotTrace and dotMemory implement closer to static analysis that ReSharper excels at, and make profiling data more easily accessible in the code editor, during your day-to-day code maintenance activities.

What it means to you

First of all, if you’re only licensed to ReSharper and/or ReSharper C++, changes in the way we’re licensing dotCover, dotTrace and dotMemory don’t affect you at all.

If you are licensed to dotCover, dotTrace and/or dotMemory, then depending on the current set of licenses that you have, we hope that you can make an informed decision whether to convert to a ReSharper Ultimate subscription, and this post serves to help you with this.

We will consider 4 major cases, so that you need to only read through the section that reflects your particular situation and the changes your licensing and associated costs would undergo.

What is common for all cases:

  • Whenever we compare licensing costs before and after licensing changes, we assume regular renewals both with traditional licenses and with subscriptions. There are certainly other kinds of renew behavior with traditional licenses but they’re not directly comparable with subscriptions.
  • We start with a comparison table with Old-Cost vs. New-Cost rows, and Personal vs. Commercial columns broken into 1- and 3-year time spans, to help you consider the change in a long term. Whenever necessary, we’re presenting Min.-Max. price ranges instead of fixed prices.
  • We use special subscription pricing offered for all existing customers, which implies that every active license (or a license with an upgrade subscription that has expired less than a year ago) makes you eligible to receive 2 initial years of new subscription for the price of 1 year.
  • USD prices are used for simplicity.

Please take your time and review the scenarios suggested below:

Converting ReSharper Ultimate to subscription

If you already own a ReSharper Ultimate license, then you’re not dealing with separate licenses, and the only decision to make has to do with converting to the new subscription-based licensing model.

Also, there’s no way to compare ReSharper Ultimate subscription costs with renewal costs in the traditional licensing model: as ReSharper Ultimate is less than a year old, we simply have not had the opportunity to announce renewal pricing.

Personal licenses

Personal license holders are fine in terms of early cost even compared to the traditional new license pricing: upon conversion to the subscription model, a personal ReSharper Ultimate subscription is going to cost $89 for two initial years + $89 each subsequent year.

Commercial licenses

Converting commercial licenses is fairly straightforward as well: again, there’s nothing to compare to as we haven’t published renewal pricing for ReSharper Ultimate in the old licensing model but in the subscription-based world, a commercial ReSharper Ultimate license is going to cost $239 for two initial years + $239 each subsequent year.

Switching from combinations of licenses to .NET tools to a ReSharper Ultimate subscription

License maintenance costs in old and new licensing models (various combinations)

If you own licenses to a combination of ReSharper + dotCover, ReSharper + dotTrace, or dotTrace + dotMemory, yearly cost-wise a switch to subscriptions can result in anything from considerable savings to a slight price increase.

Personal licenses

If you’re a personal license holder, you’re saving anywhere from $49 to $99 by converting your license combo to a ReSharper Ultimate subscription that is, again, going to be worth $89 for two initial years + $89 each subsequent year.

Commercial licenses

For commercial licenses, a switch to ReSharper Ultimate subscriptions ($239 for two initial years + $239 for each subsequent year) is going to be cheaper compared to a combo of ReSharper + dotTrace or ReSharper + dotCover but a bit more expensive compared to a combo of dotTrace + dotMemory. If there’s any price increase however, it goes away in a 3-year span due to the special offer to existing customers.

If you’re a commercial customer and you’re looking to purchase ReSharper Ultimate licenses for more seats than you currently have, you can use the opportunity to “branch out” your existing licenses. The trick is that since special pricing for existing customers allows for the set of existing licenses, then if you have, say, a dotCover license and a ReSharper license, you can use them separately to switch to two ReSharper Ultimate subscriptions using the existing customer pricing, which would save you ~$470 on subscriptions in the span of 3 years.

Switching from dotTrace to ReSharper Ultimate

License maintenance costs in old and new licensing models (dotTrace)

Personal licenses

For personal license holders, even if you only own a license to dotTrace, converting to ReSharper Ultimate would cost you $10 a year less than renewing your dotTrace license each year on current terms.

Commercial licenses

For commercial licenses, switching from dotTrace-only license ($149 for current upgrade subscription renewal) to a ReSharper Ultimate subscription ($239 for two initial years + $239 for each subsequent year) is going to introduce a price increase although provided that you usually renew annually, you’re not going to feel it until the 4th year of your subscription.

If you’re concerned with long-term costs and you’re not ready to take advantage of all 5 commercial products made available by the ReSharper Ultimate license, then you might want to leave your current license and optionally purchase a traditional upgrade subscription renewal for one more year: those are still available before November 2.

Switching from dotCover or dotMemory to ReSharper Ultimate

License maintenance costs in old and new licensing models (dotCover or dotMemory)

If you only have a license to dotCover or dotMemory and want to keep these products updated going forward, this will introduce a price hit of a varying degree depending on your type of licensing. However, for some uses of dotCover, this can be mitigated by an upcoming free licensing mechanism (which is described later in this post).

Personal licenses

If you’re a personal customer and you only own a license to dotMemory or dotCover, a considerable price hit should be expected: while the current license terms allow for renewing dotCover or dotMemory at $49 each, a new ReSharper Ultimate subscription is $40 a year more expensive at $89.

When deciding how to proceed, keep in mind that you certainly have the option to just keep your existing license using the old licensing model without paying anything extra. Should you decide that this is the best way, then optionally, if your free upgrade period is coming (or has recently come) to a close, you can use the time before November 2 to renew your upgrade subscription period on old terms for one more year.

Commercial licenses

If you’re a commercial customer with only dotMemory or dotCover licenses, there’s quite a steep cost increase associated with moving to ReSharper Ultimate subscriptions: in the old licensing system, renewing a commercial dotCover license for a year is worth $99 and dotMemory $79 whereas a ReSharper Ultimate subscription for existing customers is going to be available for $239 for two initial years + $239 each subsequent year.

If you’re not ready to subscribe to ReSharper Ultimate, you can certainly keep your current licenses and optionally purchase an additional year of free upgrade subscription on old terms before November 2.

With commercial dotCover licenses however, if you’ve been maintaining them with a sole reason to use dotCover’s console runner on your CI servers, then the good news is that we’re going to introduce a free license to dotCover Command Line Tools (see more on this below.)

In other news: expect a free license to dotCover Command Line Tools

While dotCover is primarily intended to be used as a Visual Studio plugin for unit testing and code coverage, this is not its only use.

For example, dotCover has a console runner that is available out-of-the-box and for free with TeamCity. It is also possible to integrate it with other Continuous Integration servers in order to keep up to date with code coverage stats continuously. However in order to integrate dotCover console runner with Continuous Integration tools other than TeamCity, customers had to scratch their heads over the way this kind of usage was meant to be licensed, and usually ended up purchasing standard commercial licenses to dotCover.

We’d like to streamline the usage of dotCover console runner on external CI servers, and to do this, we’re going to provide a free license to dotCover Command Line Tools, similar to the license under which ReSharper Command Line Tools are available. We expect to finalize the license by November 2 so that you don’t have to subscribe to ReSharper Ultimate if the only usage you’re interested in is the usage of dotCover console runner with your CI server of choice.

What you need to do with regard to the licensing changes

1. First of all, we suggest that you take your time and consider all the pros and cons of new licensing opportunities for yourself or your company. For more information on the new subscription scheme in general, you can refer to the JetBrains Toolbox web site and JetBrains FAQ. If questions remain, please feel free to ask them here in this blog post or by contacting JetBrains sales.

2. Should you decide that converting to a ReSharper Ultimate subscription doesn’t suit you, you can safely stay with your current license. If you want to have another year of free upgrades within your existing license and without converting to a subscription, you can purchase an upgrade subscription renewal before November 2.

3. If you decide to convert to a ReSharper Ultimate subscription, you don’t need to do anything immediately; rather, you can proceed to converting your licenses to subscriptions on or after November 2.

All ReSharper Ultimate tools bumped up to version 10

$
0
0

If you have started to use ReSharper 10 EAP (build 4 or later), a strange detail might have caught your attention:

Several v10 products as seen in the ReSharper Ultimate installer

Wut? Is it a bug? OK, ReSharper was meant to be versioned 10 but other Ultimate tools clearly weren’t.

Well, there’s no mistake. We have decided to align versioning across the entire ReSharper Ultimate family starting with ReSharper version 10.

Also, by virtue of this uniform versioning, we can finally refer to the entire set of tools as ReSharper Ultimate 10.

Granted, it’s bizarre for some products to make a switch like this: for example, dotPeek jumps from 1.5 to 10 and ReSharper C++ leaps from 1.1 to 10.

However, there’s a legitimate reason behind this.

Before last year, ReSharper, dotCover, dotTrace and other JetBrains .NET tools used to evolve more or less independently from each other, without much coordination. This all changed with the advent of ReSharper Ultimate, which brought a common installer, a common set of assemblies shared between all tools, a synchronized release cycle and unified licensing.

Along with all the advantages of the new approach, it brought a new restriction: if you were to use multiple tools from the ReSharper Ultimate pack, you could only use versions released simultaneously. Installing, say, ReSharper 9.1 released in April 2015 alongside dotMemory 4 released in December 2014 wasn’t possible anymore: you had to make sure that versions you installed were aligned in terms of release dates.

However, disparate versioning used by different ReSharper Ultimate tools didn’t help anyone figure out which versions were compatible and which were not.

Taking all this in mind, we sat down and thought, which of the two main considerations behind versioning was more relevant at this point in ReSharper Ultimate history: a way to indicate which releases of each particular product had more important changes than its other releases, or a way to unequivocally identify which ReSharper Ultimate products were guaranteed to work alongside each other.

In the end, although it wasn’t apparent to everyone and took quite a while to agree on, we figured that the latter was more important today and going forward.

In practical terms, the new versioning should be read as follows:

  • ReSharper Ultimate products having the same version (10 and onward) are guaranteed to be compatible.
  • Advancing a version number (10 to 10.1 or 10.2 to 11) will usually indicate considerable changes in the flagship product, ReSharper. Other Ultimate products may or may not receive comparable changes but will still advance their version numbers accordingly in order to make absolutely clear that they are expected to work with each other.

While we realize that this change is somewhat unorthodox, we’re really hopeful that in practice it helps you figure out more easily which combinations of ReSharper Ultimate tools are safe to be used together.

ReSharper Ultimate 10 EAP 5

$
0
0

Last Friday saw the release of a new ReSharper Ultimate 10 EAP build. Highlights of EAP 5 include notable changes in ReSharper and dotMemory, as well as dotTrace integrating its Timeline profiling functionality right in Visual Studio.

ReSharper

Revised Stack Trace Explorer

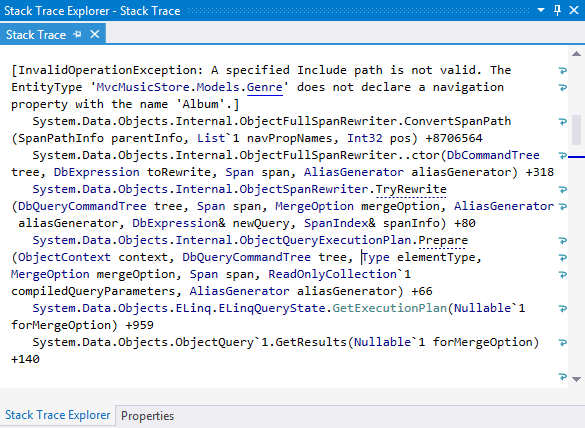
ReSharper’s Stack Trace Explorer tool window has been basically rewritten from scratch. Among other effects, this enabled Stack Trace Explorer to:

  • Provide links to types in addition to methods.
  • Parse more types of data, including WinDbg GCRoot dumps and Visual Studio’s Call Stack tool window contents.

Stack Trace Explorer

The update to Stack Trace Explorer also affects ReSharper’s Unit Test Sessions tool window where it is used to display call stacks in unit test output and provide links to relevant source code locations.

Support for Google Protocol Buffers (Protobuf)

You don’t use Google Protobuf too often but when you do, you can now lean on ReSharper to ensure proper IDE support in .proto files. This includes syntax highlighting, code analysis, code completion and navigation.
Support for Google Protocol Buffers
In terms of Protobuf versions, both 2.x and 3.0 syntax is supported.

Other changes

Other notable changes in ReSharper 10 EAP 5 include:

  • More C# code style inspections and quick-fixes, such as those helping get rid of redundant parentheses, or add parentheses to disambiguate precedence.
  • Support for different kinds of JSDoc type annotations, including symbol names, unions, parameter annotations, type definitions and callbacks.

Here’s the full list of fixes in ReSharper 10 EAP 5.

dotTrace

Timeline profiling integrated in Visual Studio

dotTrace integration in Visual Studio has traditionally been sketchy but here’s an important step to change this. From now on, when you choose to profile your startup project from Visual Studio in Timeline mode, you can view the resulting snapshot right in Visual Studio, using the Performance Snapshots Browser tool window.
Timeline profiling in Visual Studio

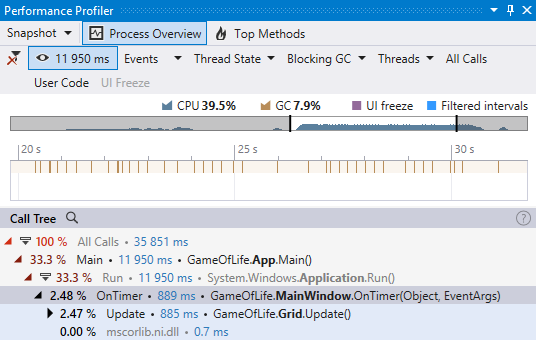
Available controls include the timeline view that you can zoom into, as well as the call tree, thread and thread state selectors, event filters, and a switch to focus on user code.

Whenever necessary, you can choose to open a particular snapshot in the standalone dotTrace Timeline Viewer.

dotMemory

Navigate from memory snapshot to code in Visual Studio

Starting from this EAP, dotMemory introduces a new contextual option that lets you navigate from any object set to its corresponding type in an open Visual Studio instance. If the target type is a library type, this triggers ReSharper’s decompiling functionality and opens decompiled code in Visual Studio.
Go to type declaration in Visual Studio from dotMemory

Wrapping it up

As usual, this is where you can download ReSharper 10 EAP from.

Experiencing issues with the EAP? Please report them to issue trackers of affected products as we’re right now trying to stabilize everything that’s inside so that the expected November 2 release is as smooth as possible.

Issue trackers are as follows: ReSharper, ReSharper C++, dotTrace, dotCover, dotMemory, dotPeek.


ReSharper Ultimate EAP 7

$
0
0

Today we have prepared a fresh ReSharper Ultimate EAP build. EAP 7 is mostly about fixes and stabilization across all the tools from ReSharper Ultimate family, and we encourage you to download and try it if you didn’t have a chance to do it earlier. As ReSharper Ultimate 10 release is just around the corner, we need your feedback as soon as possible, so if anything is not working, please let us know.

Here is quick wrap up of what this build has to offer:

ReSharper

  • Improved performance of Unit Testing, along with several important bug-fixes for issues discovered in previous EAP builds.
  • Updated default severities for some of the code style inspections.
  • Template completion (Shift+Enter on selected method or constructor)
  • A set of fixes related to UWP support for the latest update of Windows developer tools.

Here is the full list of fixes in ReSharper 10 EAP 6 and EAP 7.

ReSharper C++

In addition to a set of fixes, ReSharper C++ speeds up on solution load for already cached solutions and receives support for char16_t and char32_t built in types.

dotCover

dotCover comes with several fixes for Continuous Testing, and a fix for the issue with huge icons in high DPI.

dotMemory

dotMemory receives the start screen similar to dotTrace Home. The new dotMemory Home screen can be used as a starting point to memory profiling that lets you launch a new local or remote profiling session, attach to a running process, configure the profiling session and more.
dotMemory start screen
Every application type will offer different settings for running and profiling the application. Selecting the Advanced checkbox will provide additional options, such as filtering for child processes we might want to exclude from profiling session.

What’s next?

We plan to publish more EAP builds later this week, since the release is scheduled for November, 2. Please report any problem you might encounter to issue trackers of affected products. Here are the corresponding links for your reference: ReSharper, ReSharper C++, dotTrace, dotCover, dotMemory, dotPeek.

Welcome ReSharper Ultimate 10 RTM

$
0
0

We are here to let you know that the final release of ReSharper Ultimate 10 is now available for download!

ReSharper Ultimate 10

As described earlier, all ReSharper Ultimate family tools now share a common version number to simplify dealing with compatibility issues, so please welcome ReSharper 10, ReSharper C++ 10, dotTrace 10, dotCover 10, dotMemory 10 and dotPeek 10.

Watch this video for an overview of what is new in ReSharper Ultimate 10:

Here is a quick recap of what is new for each of the tools, if you prefer text.

ReSharper 10

In addition to around 450 fixes, highlights of ReSharper 10 include:

  • ReSharper Build is a new out-of-process incremental build tool that can take advantage of multiple processes, visualizes different kinds of project build status, and is optimized for large solutions with lots of dependencies. ReSharper Build
    Read this post for more details on ReSharper Build.
  • Built-in postfix templates. One of the most popular plugins gets integrated into mainline ReSharper. Postfix templates allow reducing backward caret jumps while typing C# code. For example, you can start with an expression and proceed to wrap it into an if statement to check whether it returns true. Another template allows you to throw an exception if certain condition is met. Postfix templates
  • Usage-aware Go to Declaration. ReSharper 10 extends the functionality of Go to declaration (as well as Ctrl+click) so that you can also use the shortcut to look up for usages. In case you have one declaration and one usage, you can use Go to declaration to simply switch between them. If you have multiple usage of a symbol, subsequent Go to declaration hits will take you to further found usages of the symbol, one usage at a time. Navigation between usages is aided by a Find Usages-like pane that enumerates found usages, contains additional controls to mouse-click between usages, and helps you flush all found usages to the regular Find Results window if you like. Usage-aware Go to declaration
  • Code style improvements. ReSharper 10 comes with a set of changes aimed to simplify configuration of and complying with code style settings. Inspection severity can now be configured right from the Alt+Enter menu, without using a modal window. Find similar issues window is now used only for searching in a custom scope. All default scopes, such as solution, project and file, can be applied right from the same old Alt+Enter menu. Additionally, there are new code inspections with quick-fixes that detect explicit or implicit access modifiers for types and type members, let you use a pre-configured order of modifiers, and help you join or separate attributes in a section.
  • Refined Stack Trace Explorer. Stack Trace Explorer was basically rewritten from scratch in ReSharper 10. This enabled Stack Trace Explorer to provide links to types in addition to methods and to parse more types of data, including WinDbg GCRoot dumps, Visual Studio Call Stack tool window contents and dotTrace snapshots.
  • NUnit 3.0 Beta 5 support. As the new major version of NUnit is approaching release, we have laid the groundwork to support it in ReSharper unit test runner. We will make more changes in order to support the release version of NUnit 3.0, though at this point the latest Beta 5 is supported.
  • JavaScript and TypeScript support improvements. Support for JSX syntax is now available in .js, .jsx and .tsx files to streamline React development in ASP.NET applications. Code completion, all ReSharper regular context actions for HTML and JavaScript, navigation to declarations and search for usages, as well as a couple of refactorings are available as well. JavaScript regular expressions that were originally supported in ReSharper 9.2 are now covered in more detail. TypeScript 1.6 support has been finalized with the addition of intersection types and class expressions. Moreover, code completion for JavaScript is now aware of types from JSDoc comments.
  • UWP device family-specific views. Universal Windows Platform enables using device family-specific XAML views to provide different UI for different types of devices. ReSharper 10 learns to handle this with dedicated code inspections, quick-fixes and context actions.Code inspections for UWP device family
  • Google Protocol Buffers (Protobuf). ReSharper 10 starts to provide support for .proto files. This includes syntax highlighting, code analysis, code completion and navigation for both 2.x and 3.0 Protobuf versions.

ReSharper C++ 10

ReSharper C++ 10 comes with 200+ fixes and a variety of enhancements:

  • Improved support for C language. ReSharper C++ 10 provides full support for C99, including designated initializers. C11 is supported to the same extent that Visual Studio supports it. Code completion and some context actions that are specific for C language are introduced with this release as well.Code completion for C in ReSharper C++
  • New context actions. There is a new action to create a derived class when standing on a class declaration. Other new context actions help replace decltype with the underlying type, as well as substitute a template type alias.
  • New code inspections and quick-fixes. We’ve introduced a new code inspection that detects whether a class needs a user defined constructor with a quick-fix to generate it. Another new code inspection detects uninitialized base class in a constructor and offers a quick-fix to initialize it. Additionally, we added quick-fixes for mismatched class tags highlighting, a quick-fix to add a template argument list and a quick-fix to make base function virtual.Make base function virtual quick-fix
  • ReSharper C++ 10 inherits the updated usage-aware Go to declaration mechanic from the mainline ReSharper. From now on you can use the single shortcut not only to switch from declaration to definition, but also to navigate through usages.
  • Code generation. ReSharper C++ 10 allows generating definitions for a function inline. We’ve also added support for generating Google Mock stubs for those who use Google Test framework.
  • Performance was one of our priorities for this release, and as a result ReSharper C++ 10 works significantly faster on solutions that had already been cached.

dotCover 10

The main highlight for dotCover 10 release is the long-awaited Continuous Testing functionality. Following an initial code coverage analysis of your solution, dotCover 10 learns to track your code changes, figure out which tests are affected by them, and then it can re-run the affected tests as soon as you hit Save, or use a different strategy of reacting to code changes.
Continuos testing session in dotCover 10

dotTrace 10

dotTrace integration in Visual Studio has been considerably improved with this update. With dotTrace 10 when you choose to profile your startup project from Visual Studio in Timeline mode, you can view the resulting snapshot right in Visual Studio, using the Performance Profiler tool window. You can select a particular time frame to investigate and drill into, make use of several filtering options, as well as export and save snapshots, all without leaving Visual Studio.
dotTrace 10 Timeline viewer in Visual Studio

dotMemory 10

dotMemory 10 introduces a new contextual option that lets you navigate from a type in an object set to its type declaration in an open Visual Studio instance. If the target type is a library type, this triggers ReSharper’s decompiling functionality and opens decompiled code in Visual Studio.
dotMemory 10 Find declaration in VS action

In addition, dotMemory receives a start view similar to dotTrace Home. The new dotMemory Home screen can be used as a starting point to memory profiling that lets you launch a new local or remote profiling session, attach to a running process, configure a profiling session and more.

dotPeek 10

dotPeek 10 delivers one of the most heavily requested features: you can now navigate to IL code from any point in the C# decompiled code viewer. IL code can be shown in a separate tool window or as comments to C# decompiled code.

IL viewer in dotPeek 10

Find Usages in dotPeek now works asynchronously, similarly to how it does in recent versions of ReSharper. This means that even if you started to look up for usages, you can still work with dotPeek without needing to wait until it finalizes the search.

In other news, dotPeek 10 supports color themes: you can now select one of 3 default themes, or choose to synchronize your color scheme preference with Visual Studio settings.


Get ReSharper Ultimate 10

Licensing and upgrade options

In terms of licensing and upgrades, some changes are introduced with this release:

  • ReSharper 10 is a free upgrade for you if you have a valid ReSharper upgrade subscription. ReSharper C++ 10 is free if you have a valid upgrade subscription to ReSharper C++.
  • In case your upgrade subscription expired, you can now subscribe to ReSharper, ReSharper C++, ReSharper Ultimate or All Products pack with a discount and get the second year of subscription for free. For details on how new subscription-based licensing works, please see JetBrains Toolbox.
  • Starting from November 2, 2015 dotTrace, dotCover and dotMemory are only licensed as part of ReSharper Ultimate. Read this post for details.
  • If you need a formal quote or any other assistance, you are welcome to contact JetBrains sales.

Navigating to Source Code from dotMemory

$
0
0

We always look for ways to increase the value of ReSharper Ultimate and synergize our .NET tools. For example, in ReSharper Ultimate 9.2, we made it possible to profile ReSharper’s run configurations, so if you have both dotTrace and ReSharper you can even profile individual static methods in your project.

Now the time has come for dotMemory to get its portion of ReSharper’s functionality. dotMemory always lacked the ability to examine the source code of the profiled application. Just imagine how easier life would get if you could seamlessly continue the investigation of a suspicious object (one that may cause a leak) by examining its source code. Well, starting with dotMemory 10 and ReSharper Ultimate 10, you can!

To navigate to the source code from dotMemory

  1. In Visual Studio, open the solution that you have a memory snapshot for.
  2. In dotMemory, in any view that displays object types, right-click the type you’re interested in.
    Find declaration context menu
  3. In the context menu, select Find declaration (Visual Studio)*. This will open the Find Type Declaration window that lists all found type declarations in running Visual Studio instances.
    * As an alternative to steps 2 and 3, select a type and press Ctrl+L.
    Find type declaration window
  4. Click on the found declaration to navigate to it in Visual Studio.
    Type declaration in VS

After you navigate to any type declaration at least once, the context menu will offer an additional item, Go to declaration (<solution_name>) (also available via the Ctrl+L shortcut). Selecting it instantly navigates you to the type declaration in a specific solution, bypassing the Find Type Declaration window.

Go to declaration context menu

To see for yourself how the feature works, download the latest dotMemory or ReSharper Ultimate. If you have any comments or questions, please feel free to ask in the comments to this post. Your feedback is greatly appreciated!

Enters ReSharper Ultimate 10.0.2

$
0
0

Download ReSharper Ultimate 10.0.2, which includes a slew of bug fixes and improvements to ReSharper, ReSharper C++, dotTrace, dotMemory, dotCover and dotPeek.

ReSharper Ultimate 10.0.2

Highlights of this update

  • Unit testing. In addition to support for NUnit 3.0 RTM, unit testing has seen noticeable improvements in terms of support for test cases and grouping, handling of debugging sessions, time spent for setup and teardown code runs. Many presentation glitches in Unit Test Sessions have been fixed as well.
  • Bogus red code. We have fixed incorrectly highlighted red code in solutions containing .modelproj and .wixproj project types, as well as in DNX projects, projects targeting .NET Framework 4.6 and portable libraries.
  • ReSharper Build. There’s an array of improvements in the way ReSharper Build works, notably with regard to monitoring changed dependencies, respecting settings that govern whether to display results upon completing a rebuild, and better support for specifics of Visual Studio 2015.
  • JavaScript and TypeScript. Improvements include a performance tuneup, as well as fixes to incorrect code inspections, usage search and navigation.
  • In other news, Stack Trace Explorer has received a set of fixes; you can now disable ReSharper code tooltip if you prefer how other Visual Studio extensions decorate the tooltip; introducing a variable from inside a lambda expression doesn’t produce broken code anymore; and you can export items from File Structure again!

ReSharper C++, dotCover, dotTrace, dotMemory and dotPeek have received their varying shares of bug fixing in the past month but it’s ReSharper that leads the breed in terms of sheer number of improvements. For your reference, this is how distribution by subsystem looks like for issues fixed in ReSharper 10.0.2:

ReSharper 10.0.2: fixed issues by subsystem

If you’re interested, here’s the entire list of fixes across ReSharper Ultimate products.

Important note to Visual Studio 2015 users

If you have migrated to Visual Studio 2015, please make sure to install VS2015 Update 1. This is especially important if you are experiencing Visual Studio freezes upon starting debugging, pulling from your VCS repository, starting a refactoring, editing XAML in visual mode or in other scenarios described in comments to RSRP-450181. Visual Studio 2015 Update 1 is known to fix a part of MSBuild calls that these freezes are usually traced back to.

Time to download

Upon reading the above, we hope you’re now well prepared to download and install ReSharper Ultimate 10.0.2.

This release wraps up the year for the .NET team here at JetBrains. We’d like to welcome 2016, and we’re hoping to open EAP for a new ReSharper Ultimate release sometime in January.

ReSharper Ultimate 10.1 EAP 2

$
0
0

The first EAP build of ReSharper Ultimate 10.1 introduced a massive list of new features and improvements, which spanned two blog posts. And here we are today with another EAP build, which you can give a try right away.

ReSharper

The most notable changes in ReSharper were merged this time by the JavaScript/TypeScript team. Among these changes are improvements in performance of caches and File Structure view, reworked Rename refactoring (which can now rename files corresponding to TypeScript types), as well as support for TypeScript implementations and overrides in Find Usages.

TypeScript keywords var, let, and const are now resolved according to the types they reference. This means that you can Ctrl-click these keywords to go the corresponding type declarations or just hover the mouse over to learn what a keyword refers to.

ReSharper support for var, let, const in TypeScript

JavaScript/TypeScript formatter settings became much more granular. You can now specify the right margin for your code and define whether and how various code constructs should be wrapped. For example, you can specify where to place dots in multi-line chained method calls or you can opt for a ‘comma-first’ style for lists, object literals and function calls.

New features in JavaScript and TypeScript formatter

ReSharper 10.1 also brings initial support for Node.js. All ReSharper goodies you are well familiar with, like completion, code inspections, quick-fixes, and navigation features are now available for Node.js. However, we badly need your feedback on how ReSharper handles different things in your specific scenarios with Node.js.

ReSharper support for Node.js

dotPeek

For a long time, opening .nupkg files from disk was the only way to load assemblies from NuGet packages. In this dotPeek EAP build, you can try two more ways: find and load NuGet packages (and their dependencies if necessary) from any online package source, or load packages listed in a packages.config file in your Visual Studio project.

dotPeek: Loading assemblies from NuGet packages

Another handy improvement is that dotPeek automatically highlights usages of the symbol under the caret. We hope now that obfuscated identifiers will not get lost as easily in decompiled code.

dotPeek: highlighting symbol usages

dotMemory

All your navigation history through dotMemory profiling results is now recorded and you can quickly return to any view or diagram that you once opened using the browser-style Back and Forward buttons.

Back and Forward buttons for dotMemory

dotCover

Coverage filters, which let you ignore specific parts of your code when calculating coverage, are now supported in Continuous Testing.

Give it a try

Interested in the improvements described above? Please go on and download ReSharper Ultimate 10.1 EAP.

If you are experiencing any issues with the EAP, please report them to issue trackers of affected products: ReSharper, ReSharper C++, dotTrace, dotCover, dotMemory, dotPeek.

Viewing all 306 articles
Browse latest View live