Quantcast
Channel: dotMemory : .NET Tools | The JetBrains Blog
Viewing all 306 articles
Browse latest View live

ReSharper 2020.2.4 and Rider 2020.2.4 Are Released

$
0
0

Hello everyone,
Today we’ve published small bugfix updates to ReSharper and Rider. Here are the issues that we’ve addressed.

Rider

  • Fixed launching iOS apps on Xcode 12 simulators (RIDER-50673).

ReSharper

  • Fixed restoring unit test sessions with continuous testing: they now persist through solution reopening (RSRP-481297).

dotTrace

  • Fixed the ‘ETW collector internal error’ in Timeline profiling (DTRC-26888).

You can download Rider 2020.2.4 and ReSharper 2020.2.4 from our website or update either of them by using the Toolbox App. You can also update Rider as a snap if you are using a compatible Linux distro.


.NET Annotated Monthly | October 2020

$
0
0

A little bit of October’s computing history: In 2001, Microsoft released Windows XP! Thank goodness for the chance to get away from Windows 98 & ME. Meanwhile, Apple was busy working on consumer products and had released the iPod.

.NET Annotated Monthly newsletter by JetBrains!

.NET news

.NET tutorials and tips

The Curious Developer’s Guide to Portable Azure Functions – Want to take your .NET code to the cloud? Wondering what serverless applications are? Azure Functions is an excellent way to do so. So check out this tutorial by Linda Nichols, go serverless, and get started with Azure Functions.

.NET Memory Performance Analysis – Maoni Stephens is at it again with another excellent and comprehensive document going into the depths of .NET memory management and performance.

Assembly Versioning and DLL Hell in C# .NET Framework: Problems and Solutions – DLL hell didn’t end when .NET started? For some, it’s still a nightmare, but one you can escape. Let Michael Shpilt show you how.

Anchor navigation in a Blazor application – Blazor is Microsoft’s hot new technology on the ASP.NET stack. Gérald Barré has been blogging about it, and this month, brings us some great tips on anchor navigation in Blazor apps.

C# 9.0: Target-typed New Expressions – Make Your Initialization Code Less Verbose -Thomas Claudius Huber

ArrayPool vs MemoryPool—minimizing allocations in AIS.NET – Ian Griffiths has published an in-depth post how his team has "discovered, diagnosed, and then fixed a memory allocation related performance issue in a .NET component designed for high-volume, high-efficiency processing of location data". This is very useful!

The 68 things the CLR does before executing a single line of your code – Every single line of code that’s executed in a high level language (any .NET language) goes through a lengthy process before it can actually run. Matt Warren gives a rundown of this process.

Don’t Let Your .NET Applications Fail: Resiliency with Polly – Resiliency, and reacting to and fixing problems as they occur is an often overlooked aspect of software development. So make sure to check out this post by Dmitrij Kovaliov detailing how you can create more resilient apps with Polly.

How to deploy Blazor WASM & Azure Functions to Azure Static Web Apps – Shipping is a feature! So let Niels Swimberghe show you how it’s done. Finally get that Blazor WASM & AF app deployed to Azure as a static web app.

Running SQL Server Integration Tests in .NET Core Projects via Docker – In this article, Georg Dangl demonstrates how to run SQL integration tests in .NET Core, with Docker. It’s something many enterprise developers need.

Validating an input on keypress instead of on change in Blazor – Gérald Barré shows us how to correctly validate on keypress in Blazor in this quick but useful post.

Fast Builds: Make a Url Shortener with .NET – Read Casey McQuillan’s post to learn how to make an often needed web utility: a URL shortener.

Allow Your Users to Login to your ASP.NET Core App Through Facebook – Do you want to integrate social networking into your app for extra coolness? Great! Then let David Grace show you how.

Why use MediatR? 3 reasons why and 1 reason not – What is Mediatr you ask? It’s a library that implements the mediator pattern, which defines an object that encapsulates how a set of objects interact. Derek Comartin has published a piece on why you should check it out (and one reason why you shouldn’t).

A Step by Step Guide for ASP.NET Core Configuration – Every app must be configured. It’s something we all have to do as ASP.NET developers. So read Waqas Anwar’s step by step guide showing us how.

Events, community and culture

Hacktoberfest is here! – Each year during the month of October, DigitalOcean hosts the Hackoberfest event. This means that to participate, submit a minimum of four pull requests (that’s roughly one per week) during October, and win a great t-shirt. We’re not sending you out into the land of OSS without tools, though! So if you’re participating in Hacktoberfest, we’re offering a free All Pack subscription of our tools for one month!

Interesting and cool stuff

Reading Code is a Skill – It’s harder to read code than to write it. That’s why Trisha Gee has written about reading code. Check it out!

{La Vie en Code} – Send this site to new developers on your team. Nicole Archambault has some excellent resources for new developers. Courses, blog posts, a podcast, and more!

Have you ever wanted to make your iPhone look like a Windows 95 desktop? Now you can. Throwbacks to retro technology like this one are super fun!

How To Structure And Motivate Your Team To Be More Collaborative – This is a much needed article, as everyone is working from home due to the COVID pandemic. Janet Mesh discusses everything needed for an excellently-functioning team from building trust, to goals, support, and more.

It’s a brand-new NODE Mini Server! – Check out the wonderfully geeky Node mini-server. It’s tiny! It’s adorable! It’s a Node server! Get the details from Ashley Whittaker.

Here is some great advice from Jeff Handley. Think about how software will be reused before you design for reusability.

The Importance Of Branding Projects – Developers would like to think that branding and marketing isn’t important, and that projects and products can simply speak for themsevles via the quality of their code. But that’s not how it works. Without branding, people are less likely to even recognize your project or know it exists. Our own Khalid Abuhakmeh demonstrates the importance of branding in software.

Computers Are Hard: app performance with Jeff Fritz – Performance. It’s a perpetual problem for programmers. Balancing speed with features, quality code, and shipping software is difficult at best. In this interview, Wojtek Borowicz talks to Jeff Fritz about performance and programming, and everything that goes with it.

In this unpopular opinion, Laurie thinks that TypeScript is more trouble than it’s worth. As they say in American Western movies, "Them’s is fightin’ words". Is she right? What do you think?

And finally…

Here’s a chance to catch up on JetBrains news that you might have missed:

Rider & R# Roadmaps are here!

Download an EAP version

Webinars

Blog posts

Check out this fantastic offer! CODE Magazine is offering a free subscription to JetBrains customers!

If you have any interesting or useful .NET or general programming news to share via .NET Annotated Monthly, leave a comment here, email me at rachel.appel@jetbrains.com, or drop me a message via Twitter.

Subscribe to .NET Annotated!

Create UML Diagrams using PlantUML

$
0
0

UML, or Unified Modeling Language, is, as the name implies, a modeling language that allows you to visualize systems. In this post, we’ll look at how PlantUML enables you to create various kinds of diagrams so that you can properly document your software. We’ll create two of the most popular UML diagram types: Class and Use Case diagrams, to demonstrate what you can do with the PlantUML plugin in Rider.

(more…)

Top-level Statements In ReSharper and Rider

$
0
0

With the upcoming release of C# 9, we’re all getting some new tools for our development toolboxes. One of the most exciting features .NET 5 is delivering to developers is top-level statements.

In this post, we’ll explore what top-level statements are, who they’re useful for, the rules of top-level statement apps, and taking a peek at intermediate language (IL) generation.

Gather round the virtual campfire 🏕, and let’s explore this topic together.

(more…)

Finding Text More Quickly with Go to Text in ReSharper

$
0
0

In ReSharper, you can use Ctrl+T to Search Everywhere. And with everywhere, we do mean everywhere! Did you know ReSharper also indexes and searches in textual content?

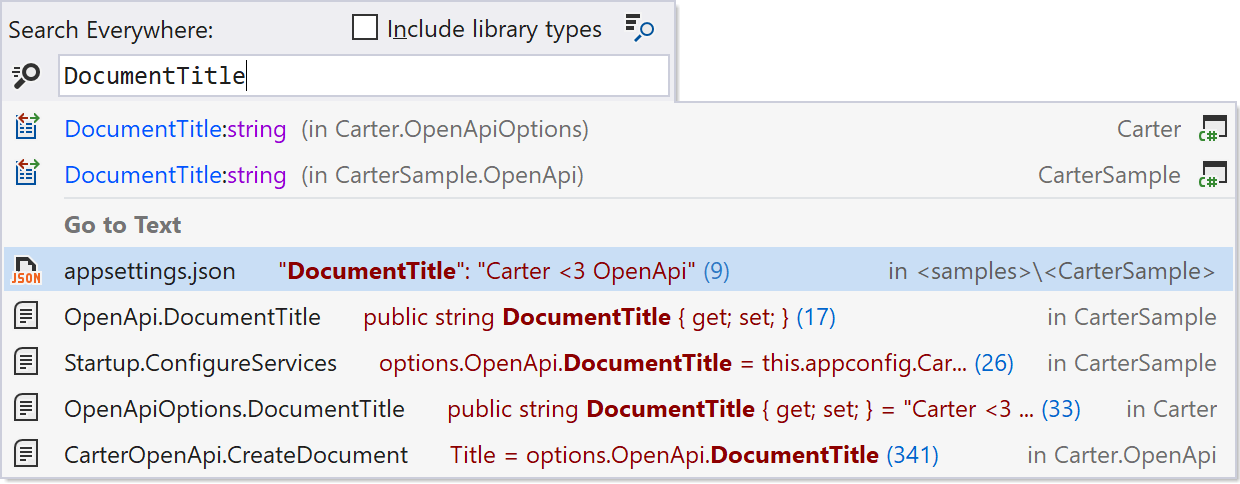
I’ll use the Carter framework as an example solution in this blog post. When searching for DocumentTitle, you can see that ReSharper finds relevant symbols (2 properties in this case), and also textual occurrences in appsettings.json and throughout the codebase.

Go to Text in Search Everywhere to find text in a solution

Go to Text helps you navigate to text in source and textual files easier and faster than using Visual Studio’s built-in Find in Files. Let’s look at it in more detail.

How does Go to Text work?

If you want to search a solution for text, such as error messages shown to the user, configuration keys, or specific comments you know exist, Go to Text can help. It lets you find text, whether the results are in source files, configuration, XML, JSON, or elsewhere.

When ReSharper indexes your solution, it tracks file names, classes, properties, methods, and other relevant symbols. ReSharper indexes raw text to make searches incredibly fast!

Fast searches allow us to include the results in Search Everywhere. ReSharper shows textual occurrences that match your query at the end of the results list, after matching types, symbols, and files.

If you intend to search for text only, you can press Ctrl+T 3 times (or use the ReSharper | Navigate | Go to Text menu) to trigger Go to Text directly.

Use go to Text direcly by pressing Ctrl+T three times

By default, Go to Text searches in all source files and other textual files. If you want to exclude files and folders, you can do so in the ReSharper options under Environment | Search & Navigation, and add them to the Elements to skip collection.

Fuzzy search

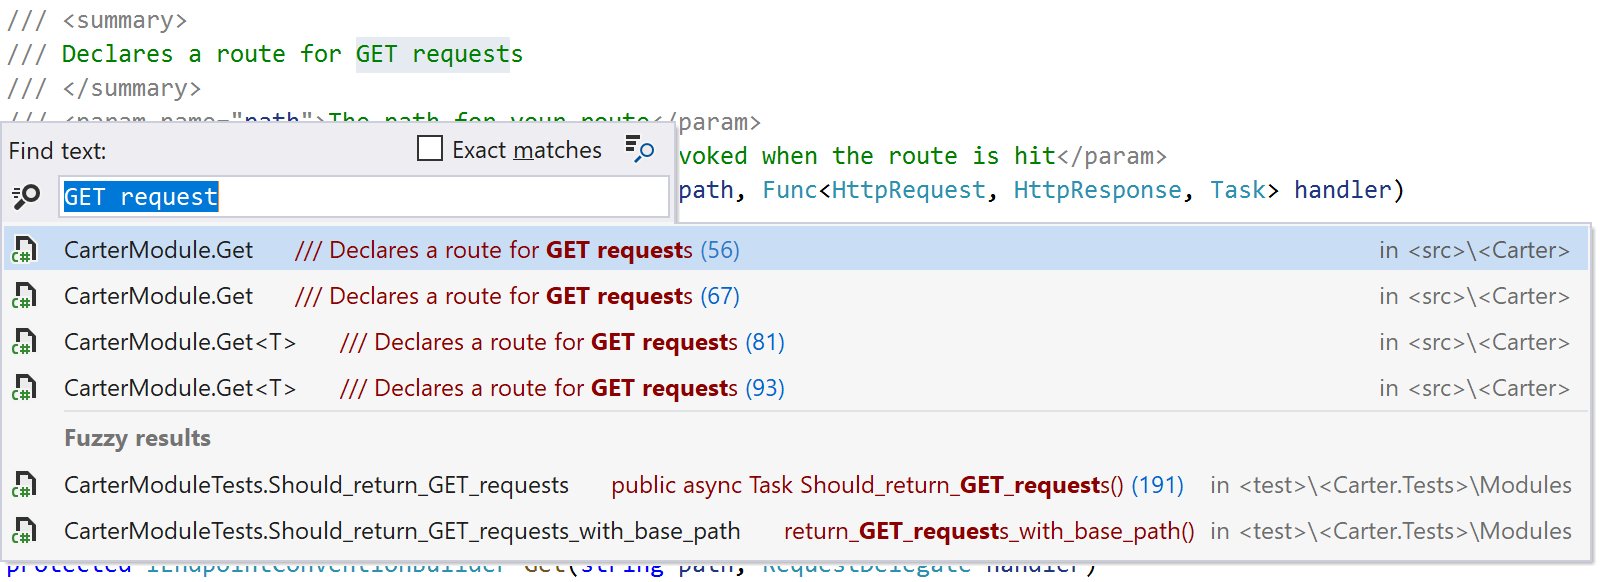
Go to Text searches for exact text matches in your solution. With ReSharper 2020.3 EAP, we’ve added fuzzy search as well.

With fuzzy search, Go to Text takes into account various typos and missing words. Press Ctrl+T 3 times, and search for something that is slightly off. Fuzzy search results are displayed in a separate section of the result set.

Fuzzy search matches incomplete words and typos

You can get more creative with fuzzy searches. Since Go to Text searches all text, you can also search source code with it – even if your search is not an exact match.

Fuzzy search for source code

An advantage is that fuzzy search can also help you find error strings, even if they contain format specifiers…

Fuzzy search for string format

…or use string interpolation.

Fuzzy search for string interpolation

Note that if you want to disable fuzzy search, you can do so in the settings (ReSharper | Options | Environment | Search & Navigation). If you have any feedback on fuzzy search let us know in the comments!

Search for selection & repeat previous searches

Many of us know the copy/paste shortcuts pretty well. Text that is copied to the clipboard will appear in the search field, so you can use that precious Ctrl+C/Ctrl+V combination. However, each of us has a finite number of keys we can type!

You can save these two keystrokes by selecting some text or code, and then use the Go to Text shortcut to start searching immediately.

Select text, press Ctrl+T three times to search for it

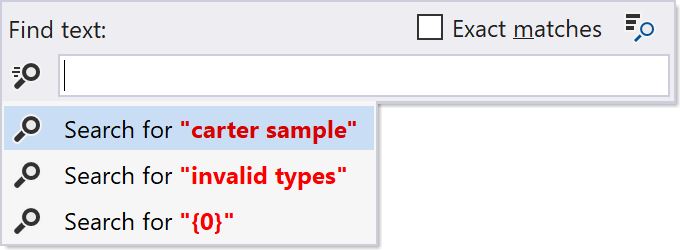
Very often, you’ll find yourself repeatedly searching for text to find the exact result. ReSharper will remember your last search, allowing you to immediately repeat it.

When you clear the search box, the last 10 searches are shown. You can use the keyboard up and down arrows to select any previous search and run it again.

Go to Text remembers previous searches

Filtering results

For some queries, you may get back a large number of results. A massive result can be overwhelming, but maybe you know which file type your result is in, or you may find the results in the current project or the current folder.

By appending a search filter to your query, you can search for text in a particular extension by using the /ext filter:

The following filters are supported:

  • /ext: limits the search to files with specific extension(s), for example /ext:cs or /ext:xml;json;
  • /fm: limits the search to files matching a specific mask, for example, /fm:I*.cs;
  • /cp limits the search to files in the current project;
  • /. limits the search to files in the current folder.

Find results tool window

For large projects, filtering can help find the expected result in one go. But what if you want to look through many results?

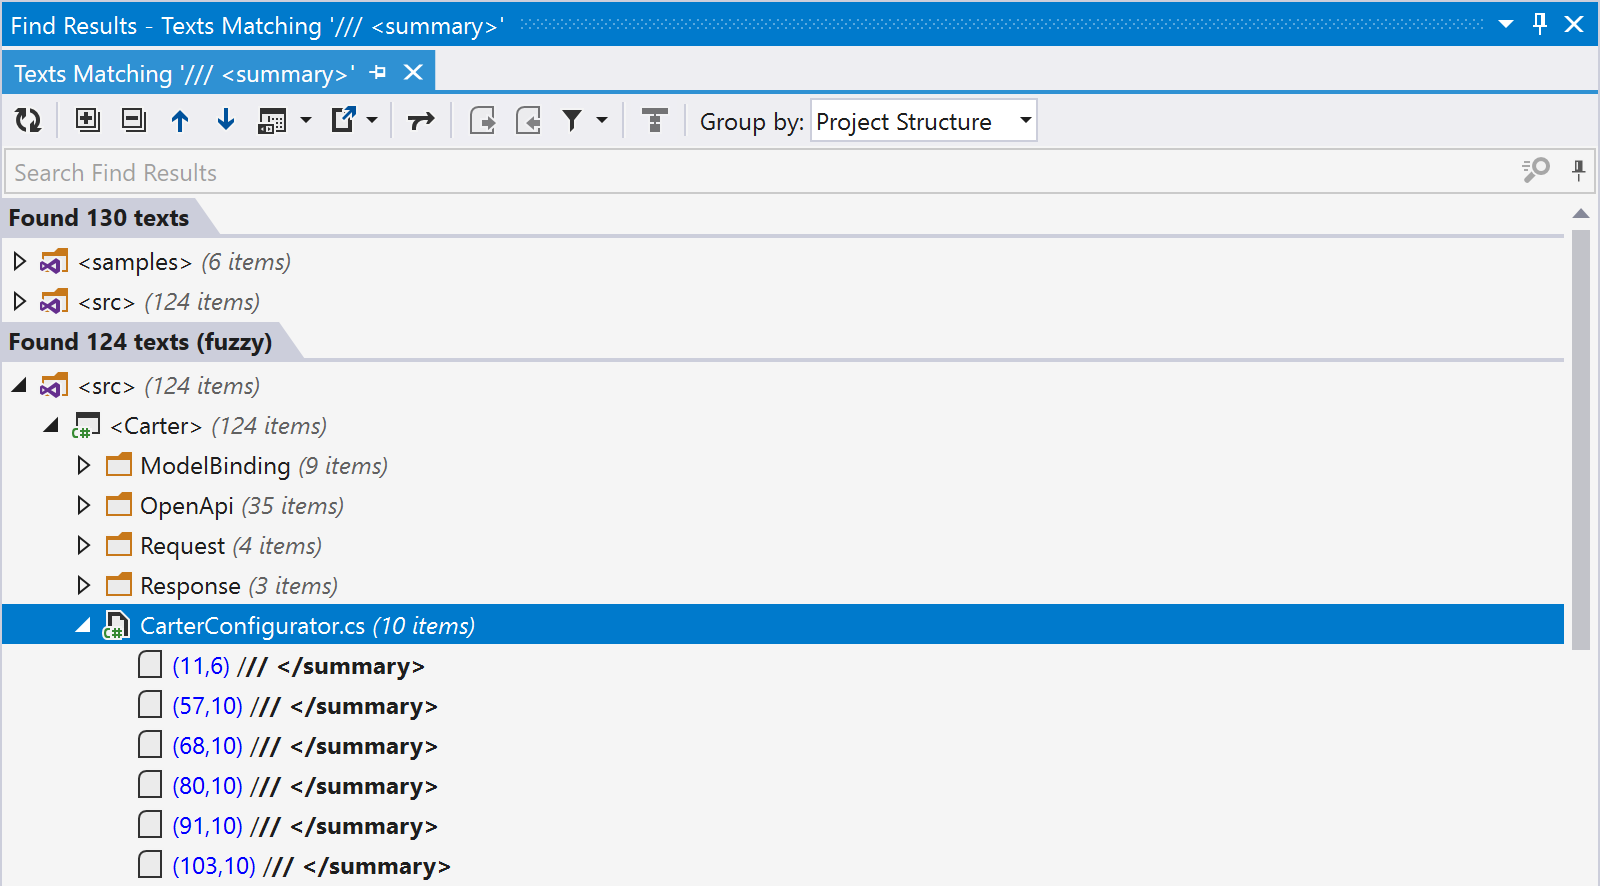
Like with other navigation features in ReSharper, you can use the Show in Find Results (+ on the numeric keypad or Shift+Enter) to show results in a separate tool window.

Find Results tool window for Go to Text

By default, search results are grouped by project structure. It may also group results differently or export results.

One of my favorite methods to help narrow search results in the Find Results tool window is to Filter Usages. The feature helps refine search results by where/how the results are used. For example, you can select to only show results that are found in unit tests, or only those in XMLDoc.

Filter results by type of usage

Give the latest ReSharper 2020.3 EAP with fuzzy search a try! Let us know what you think!

Service Creation via .NET Core Templates – Webinar recording

$
0
0

The recording of our webinar, Service Creation via .NET Core Templates, with Olga Nelioubov, is now available. Subscribe to our community newsletter to receive notifications about future webinars.


Custom .NET templates are a fantastic way to bootstrap your .NET services, however they’re not only limited to the .NET world – their usefulness could extend to templating out pipelines, applications in other languages, configuration files, or anything else that can be opened with a text editor. Furthermore, they are extremely simple to set up and can be easily packaged and distributed to others for re-use.

In this session, I’d like to go over what these .NET templates are and what makes them so useful and versatile. I’d also like to demo creating an API template, complete with an optional build and release pipeline, and then demonstrate using that template to create an out-of-the-box deployable solution.


(more…)

Immediate Window – Interact with your Code while Debugging in Rider

$
0
0

A valuable part of the debugging experience is experimentation, modifying variables and determining whether the outcomes were what we expected. With the latest release of Rider 2020.3 EAP, we’re happy to give developers more tools that make debugging more effective.

As you may have guessed from the title of this post, the Immediate Window is shipping in Rider 2020.3 EAP.

What is the Immediate Window?

The immediate window offers a way to access the code of our application while it is being executed. While debugging, we can write additional code that can add to or alter the current code execution. Rider’s Immediate Window has many of the same code editing features that we use regularly when developing. We can evaluate expressions, execute statements, print variables, and much more. Let’s take a look at some of those features now.

Using the Immediate Window

The Immediate Window becomes visible as soon as we start a debugging session. We can see the new window on the bottom-right, below the watch variables within the debugger pane.

Debugger pane in immediate window

We can toggle the Immediate Window by clicking the little terminal icon, which is right below the “show watch variables” icon (the glasses).

immediate window icon

The Immediate Window will only accept input when the application is in a paused state, likely due to hitting a breakpoint. Once the window becomes active, we can type any valid C# code, with the full range of code completion features to assist us.

Immediate Window Code Completion

We can also use shortcuts like Alt+Enter to trigger refactorings.

Alt enter example in immediate window

It is also possible to navigate from from the Immediate Window to classes and variables.

Navigation from immediate window

In the following example, we alter the value of one from 1 to 2. Note that the Immediate Window understands the execution context. Being paused in the current scope allows us to access the local variable.

Immediate Window Change Variables

In addition to being able to access previously defined members, we can also define new synthetic variables. In the following example, we instantiate a new instance of a Person class. When we create a new variable, Rider will track its value in the variables window under a synthetic variables collection. We can inspect, pin, and alter these variables under this new category like we would any other variables.

Synthetic Variables In Variable Window

We’ve discussed how to adjust existing variables and create new ones for Rider to track. We can also execute statements without needing to assign them to any variables. Rider will record the last returned value from a run statement under the $result placeholder.

Results placeholder in variables window

The Immediate Window will also track the history of all of our statements. Pressing the up and down arrow keys will cycle through all the statements we’ve executed in the Immediate Window.

Conclusion

To give the Immediate Window a try, you can download the latest version of Rider 2020.3 EAP.

We hope you enjoy using all the new features shipping with Rider, especially the Immediate Window. Remember to leave comments on this post or file issues in the Rider issue tracker.

Troubleshoot allocations with Dynamic Program Analysis – ReSharper 2020.3 EAP

$
0
0

How often do you reach for a profiler? Only when things go wrong, right? All too often, we use profilers only as a last resort, even though dotTrace and dotMemory are both pleasant to work with.

What if we told you that Dynamic Program Analysis (DPA) in ReSharper automatically analyzes the memory usage of your applications and helps catch difficult-to-diagnose memory allocation issues before we deploy them to production. Because we all know an unhappy user is an unhappier developer, let’s see how DPA can keep us happy!

Why is DPA important?

Memory allocation issues are the most difficult to catch, and the most insidious, as we can’t easily spot them during code reviews. These errors can have catastrophic consequences in our production environments. We strive to do our best to find them, but sometimes we fall short. Tools like DPA bring us closer to our goal of eliminating allocation issues.

DPA is a process that runs in the background of our application and looks for various memory allocation issues. It currently checks for closures and allocations to the large and small object heaps (LOH and SOH). It starts automatically every time we run or debug our apps, and there is almost no overhead cost associated with collecting memory allocation data.

We can set memory allocation thresholds, which means we can be selective about what constitutes a performance concern and what might be expected behavior.

Enabling DPA in ReSharper

DPA is not installed by default. Grab the latest ReSharper 2020.3 EAP if you want to give it a try!

In the ReSharper installer, you’ll have to explicitly install DPA by selecting Dynamic Program Analysis under the Available Products heading.

ReSharper Installer Window

*Tip: check out the JetBrains Toolbox App, it makes installing updates much easier.

Once that’s done, you’re good to go!

Where to find DPA?

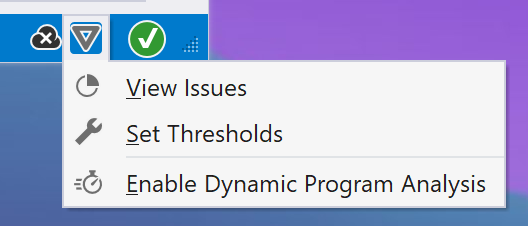
After installing DPA, we can see an upside-down triangle located on the right-hand side of the Visual Studio status bar at the bottom of the window. Clicking the icon allows us to toggle DPA functionality on or off. From this icon, we can also bring up the DPA tool window and set memory thresholds.

DPA tray icon with menu open

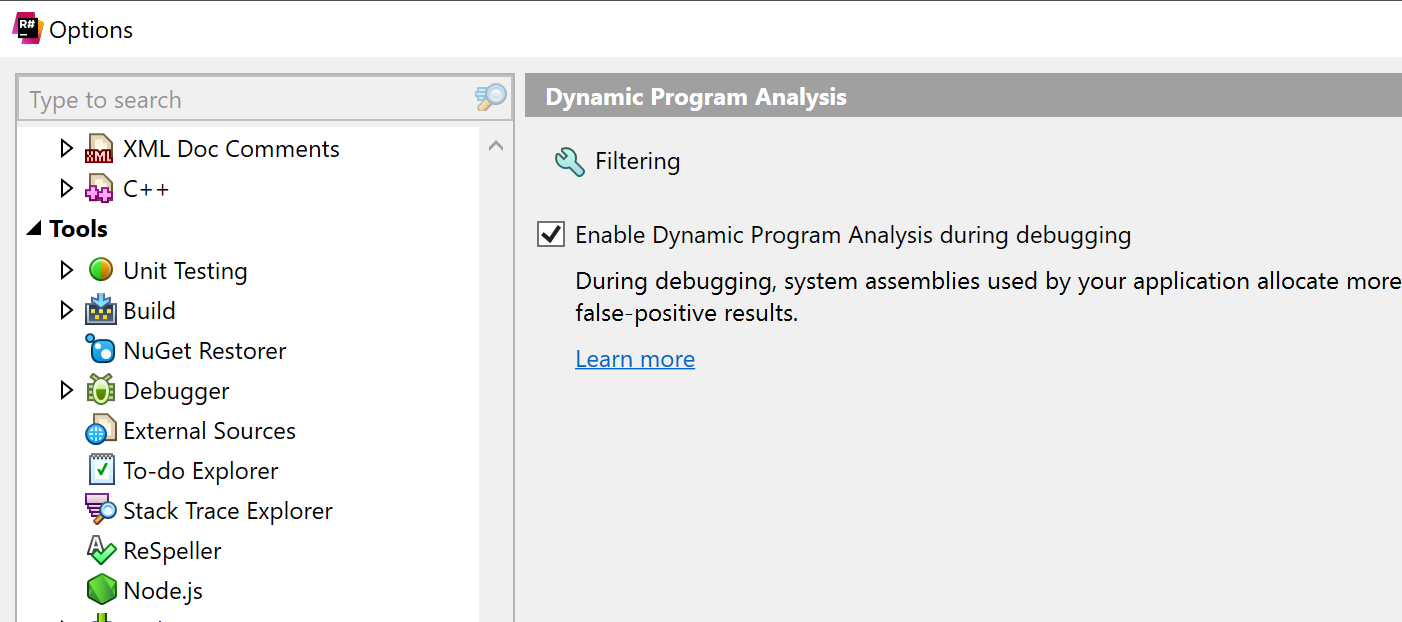
In the ReSharper options, we can decide whether to run DPA while debugging. Running DPA while debugging can lead to false positives, as the code compiled during the debugging process may perform additional memory allocations and is generally unoptimized. That said, it may provide indications of potental memory issues. We recommend running DPA in both release and debug run configurations to get a better understanding of any likely issues.

ReSharper Options to Toggle DPA while debugging

Now let’s see what information DPA can give us!

Memory allocation warnings with DPA

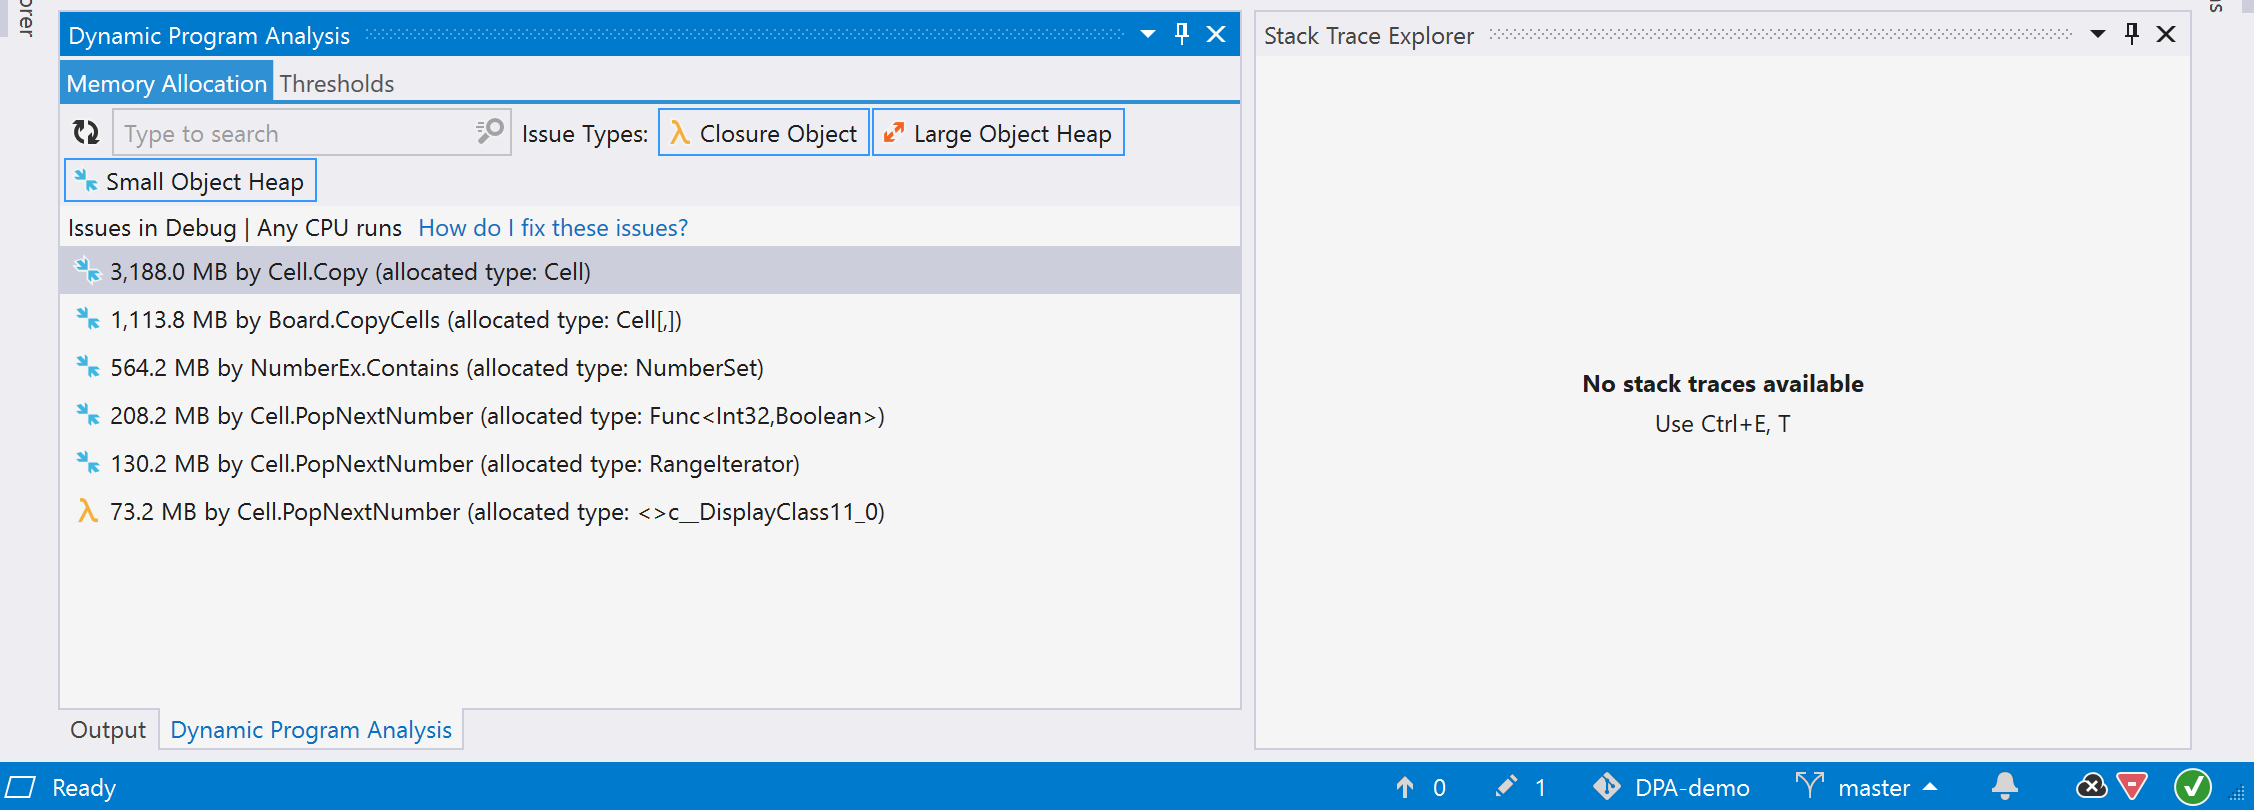
We have a sample Soduku solver application on GitHub that you can use to give DPA a try. After running it and opening the Dynamic Program Analysis tab, we can see DPA flagged some memory allocation issues around closures, the large object heap, and the small object heap. The DPA status indicator is shown in red, indicating we may have serious issues that need to be addressed.

Double-clicking any problem will open the Stack Trace Explorer, allowing us to navigate to the issue’s exact location in code.

DPA tab and stack trace explorer

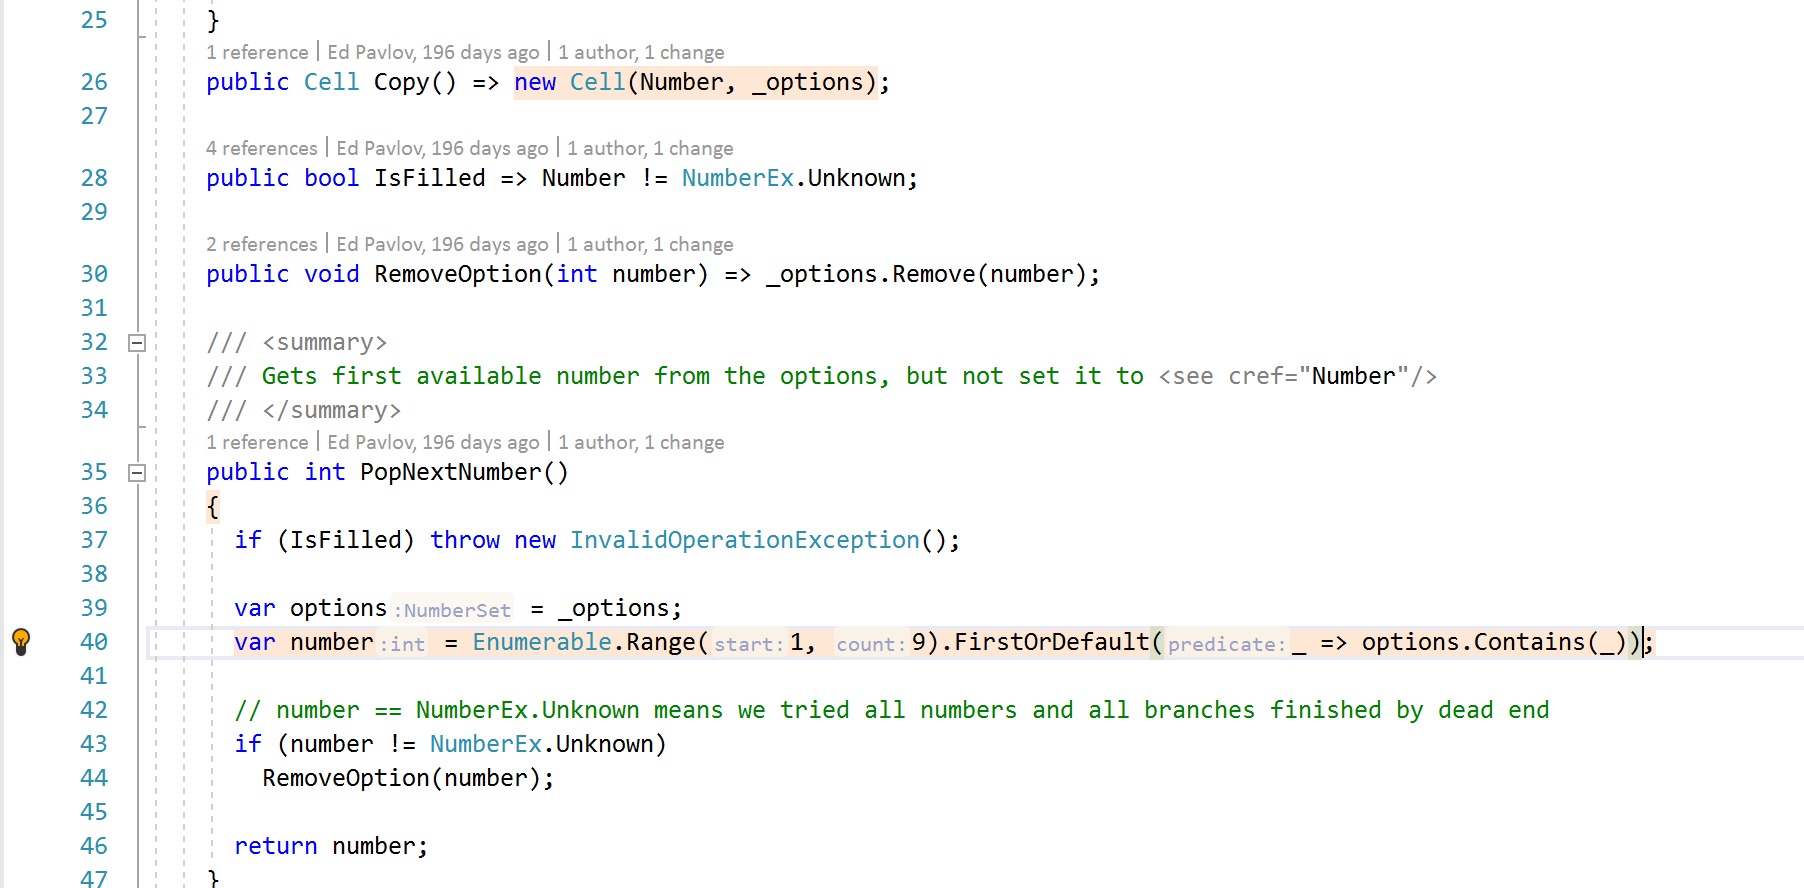
Navigating into our code, we can see memory allocation issues highlighted directly in the editor. Catching these issues can help us diagnose and eventually solve these production problems waiting to happen.

Highlighted inline code

Great, no? What incredible power at our fingertips!

Check out the Heap Allocations Viewer plugin for ReSharper, which can help you identify where an allocation may be happening. We also have some guidance about solving the types of memory allocations DPA helps discover. An older blog post highlights several other common memory allocation issues in .NET.

DPA focuses on memory allocation issues. In our experience, a large number of performance issues are related to excessive memory allocation and the garbage collection that comes with it. Quite often, such issues are the result of bad code design and can easily be fixed. For a more thorough analysis, check out dotMemory.

Setting memory thresholds

If we’re finding false positives in our results, we can adjust our memory thresholds for all three categories: Closure Objects, Large Object Heap, and Small Object Heap.

Manage memory thresholds

Conclusion

Dynamic Program Analysis is another excellent feature that helps ReSharper users produce highly efficient applications. One of the most significant aspects of DPA is that it fits into our daily development workflows, so there’s no need to block out hours to profile our apps. We highly recommend visiting our JetBrains .NET Guide, where developer advocate Maarten Balliauw shows you in depth the ways we can use DPA to build better applications.

For anyone interested in trying DPA on a project known to have memory issues, we’ve created a sample in our GitHub repository.

Please let us know in the comments what you think of DPA, and file any ReSharper feature requests or bugs in our issue tracker.


Webinar – .NET Microservices == MEGAFUN

$
0
0

Join us Tuesday, November 17, 2020, 16:00 – 17:00 CET (10:00 AM – 11:00 AM EST or check other timezones) for our free live webinar, .NET Microservices == MEGAFUN, with LaBrina Loving.

Register now and get a reminder, or join on YouTube

In this session, I will provide an overview of getting started with building and deploying Microservices. We’ll explore using services like Dapr and Project Tye to help build your microservices and look at how to deploy to Azure.

(more…)

Building A Blazor Farm Animal Soundboard

$
0
0

How’s it going, fellow Blazorinos? Here at JetBrains, we’ve been diving face-first into Blazor, improving the development experience for Blazor lovers.

For those unfamiliar with Blazor, but still familiar with front-end web development, you can think of Blazor as a front-end framework similar to VueJs or React. Blazor allows developers to build interactive user interfaces (UI) using C#, Razor, and SignalR. Introduced in ASP.NET Core 3, the architecture of Blazor leverages shareable C# code, which can run on the server and client. Developers can also expect to ship self-contained, fully running in a web browser, Blazor apps with WebAssembly.

In this beginner tutorial, we’ll be building a Farm Animal Soundboard. A soundboard is an app that lets the user push a button and play the associated sound. We’ll walk through some major elements of building a Blazor experience: Razor pages, Components, and JavaScript interoperability.

(more…)

Blazor – C# in the Browser – Webinar recording

$
0
0

The recording of our webinar, Blazor – C# in the Browser, with Brian Jablonsky, is now available. Subscribe to our community newsletter to receive notifications about future webinars.


Ever dream about being able to write your web frontend code in C#? Blazor might be your answer! It lets you write your frontend code using C# and Razor.

In this session, we’ll take a look at what Blazor is, how Blazor works, the difference between Blazor hosting models and how it relates to WebAssembly, and build a Blazor web app using Rider.


(more…)

Project Dependency Diagrams come to Rider 2020.3

$
0
0

In the latest Rider 2020.3 Early Access Preview (EAP) builds, we’re bringing in Project Dependency Diagrams from ReSharper!

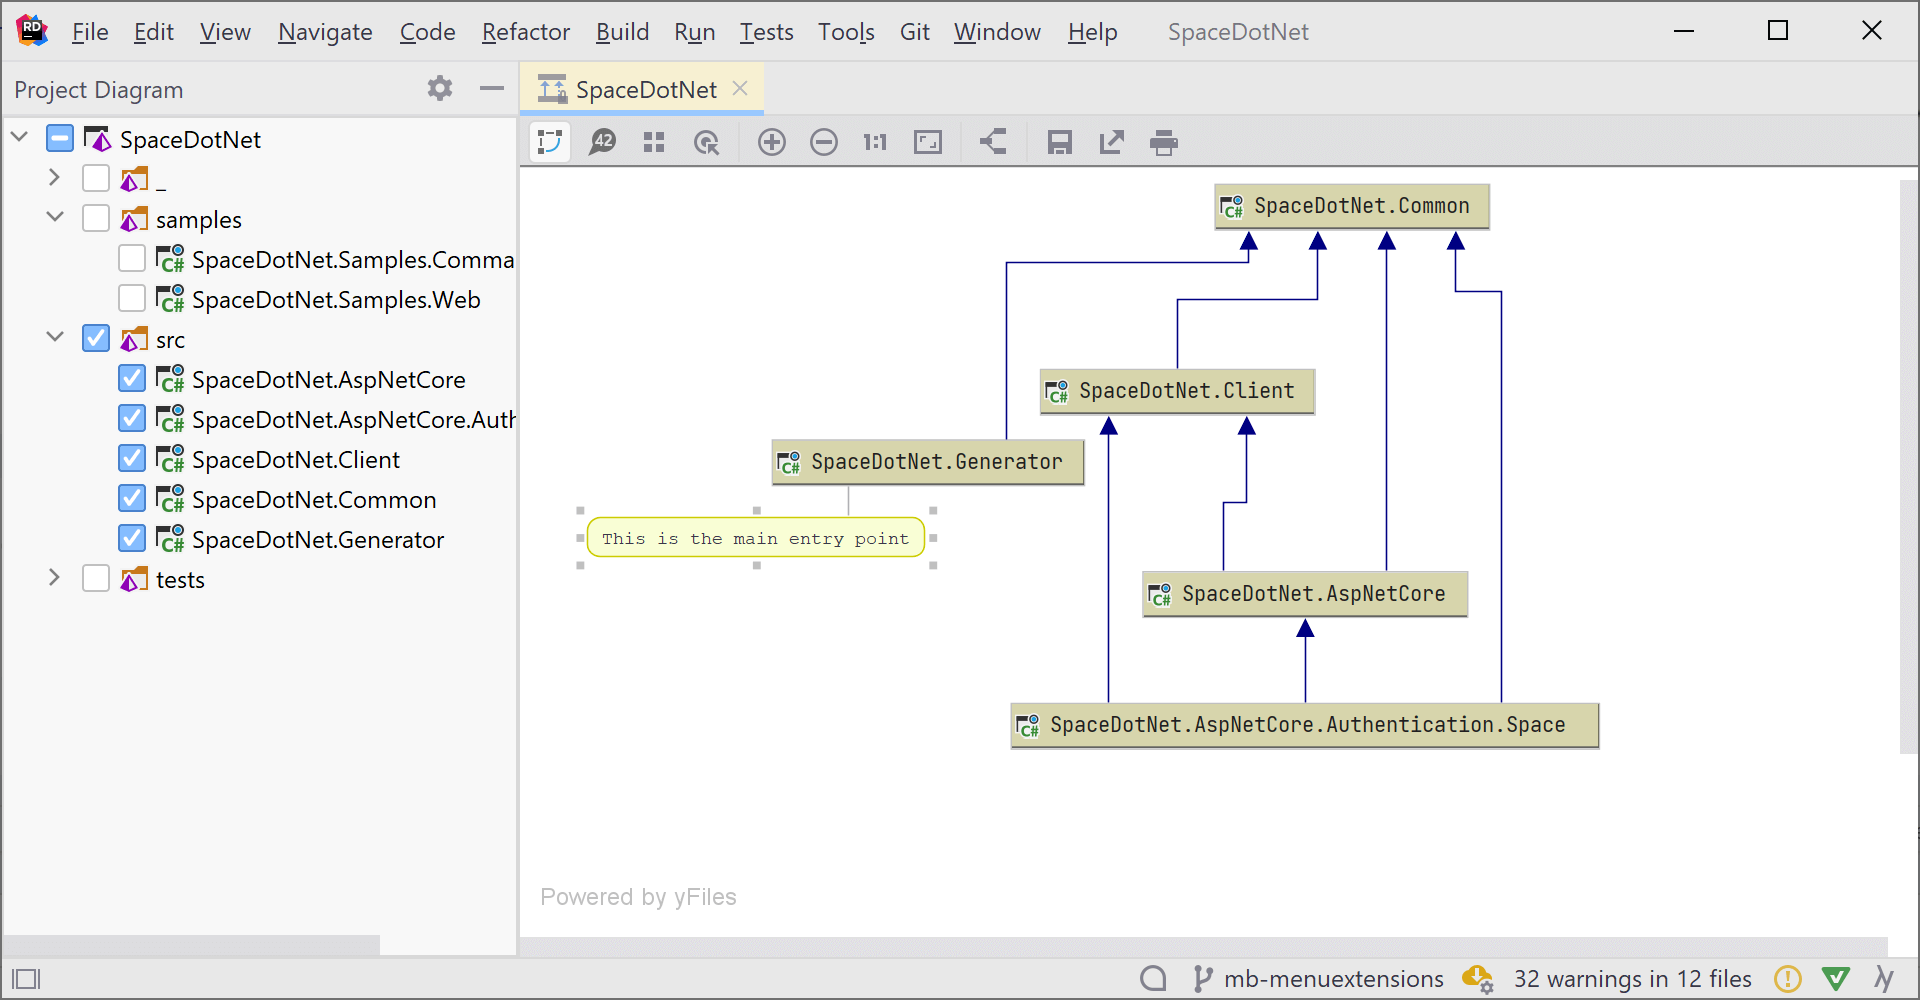
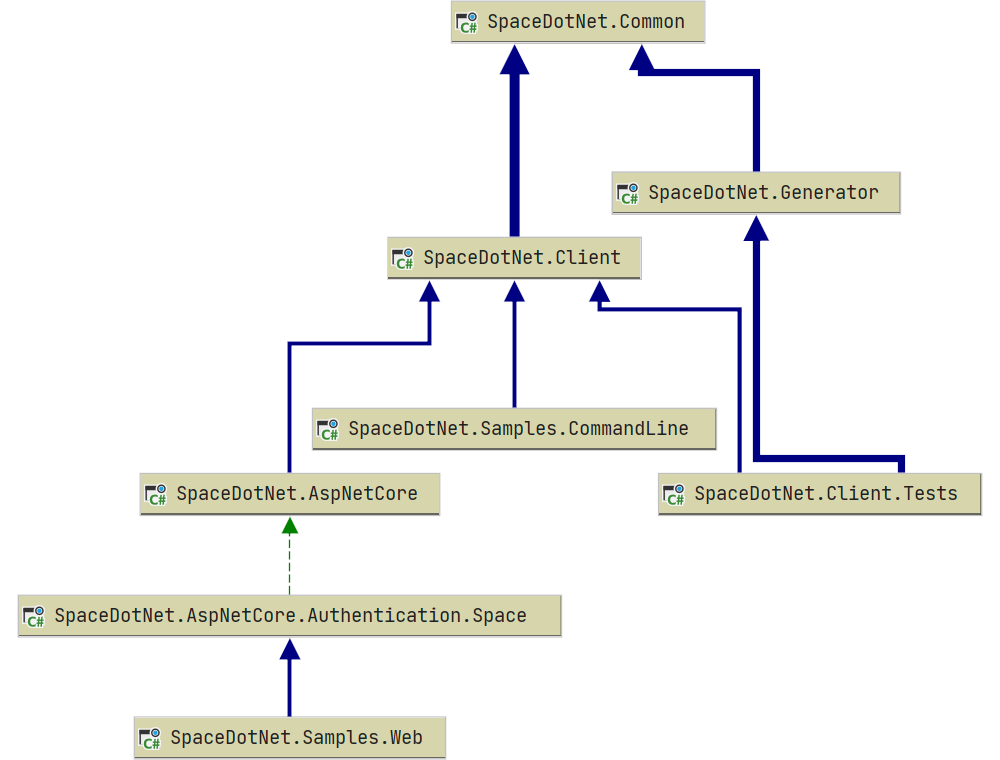
With project dependency diagrams you can visualize project dependencies in your solution, and explore its architecture. In this post, we’ll have a look at what project dependency diagrams look like, what information they show, and how we can use them to analyze project coupling in a solution.

Hello, project dependency diagrams!

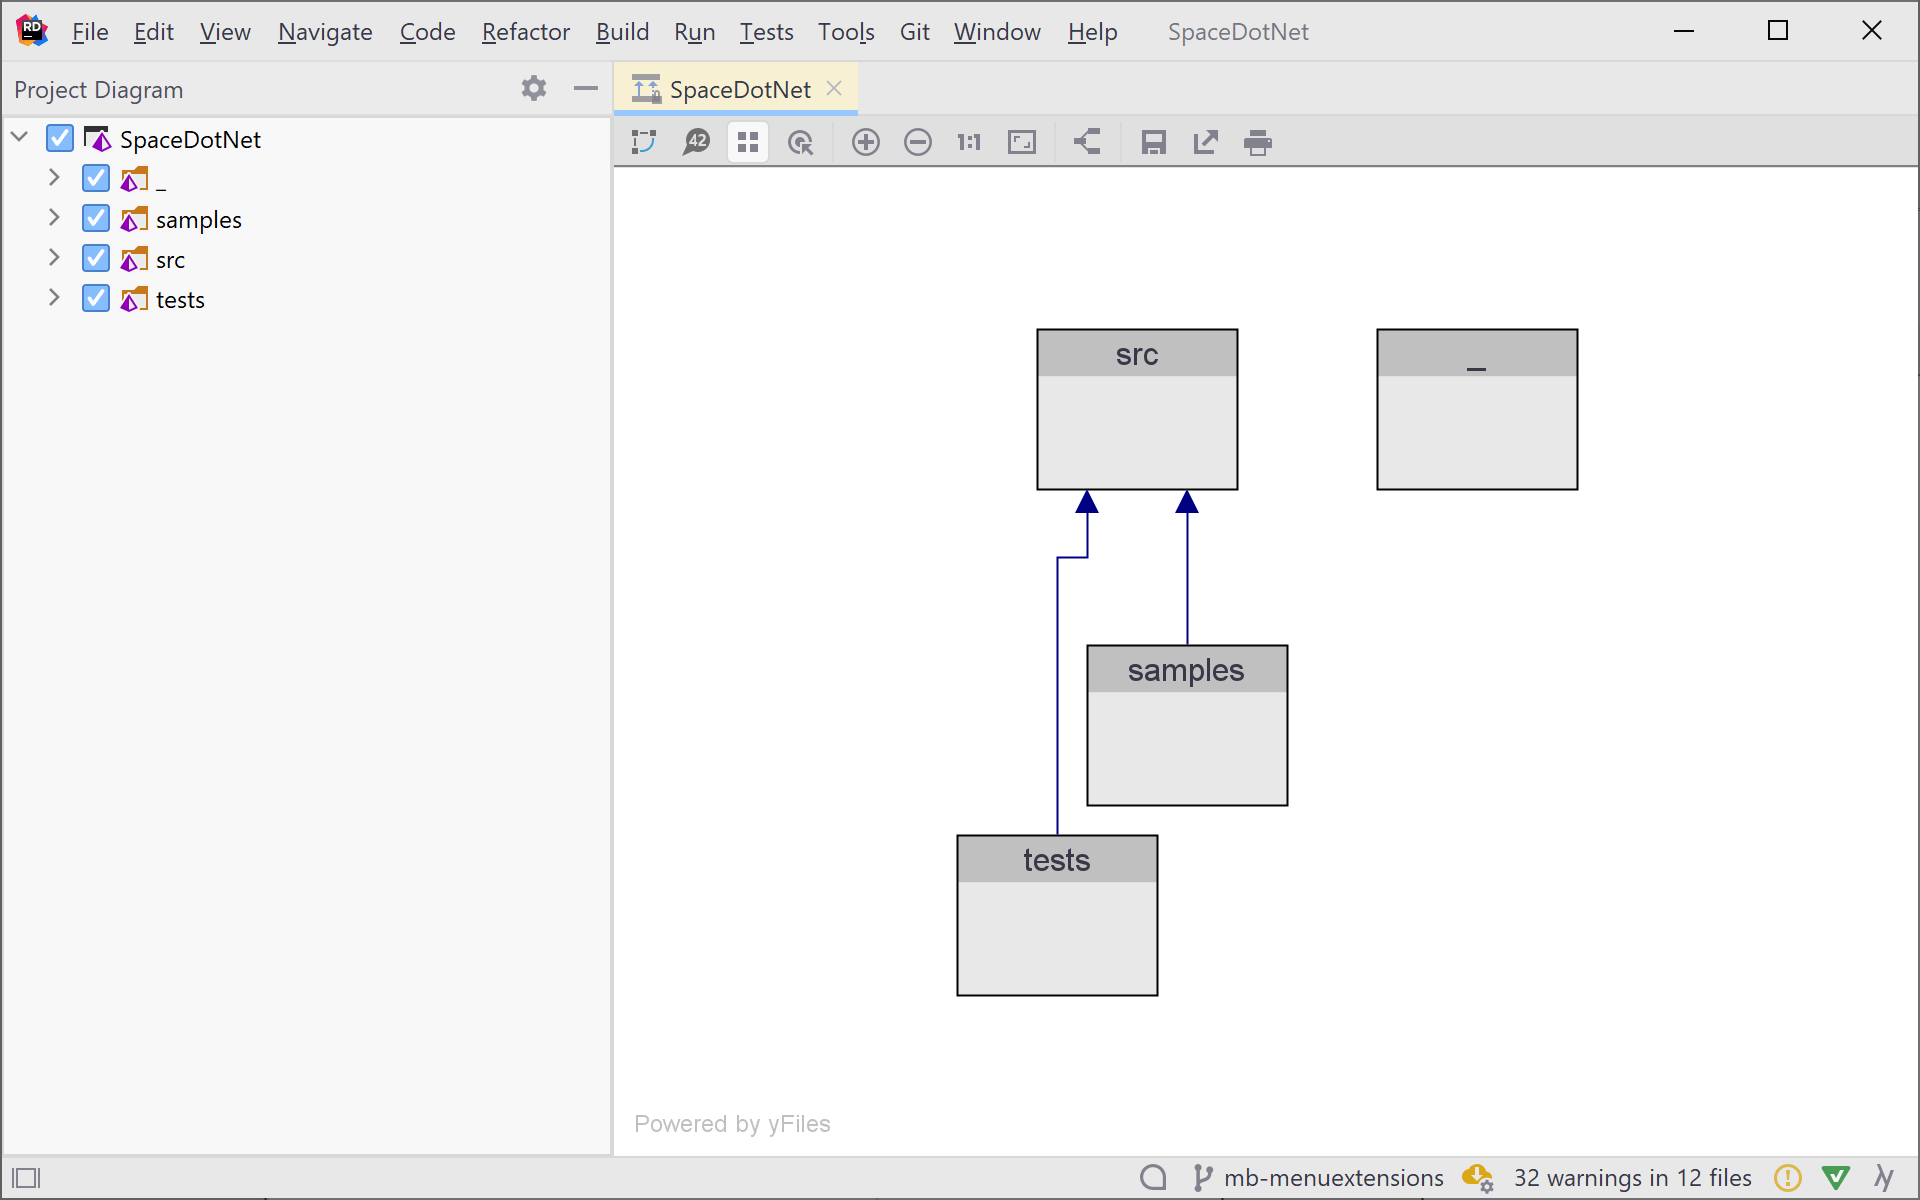
You can open the project dependency diagram from the context menu in solution explorer, or by using the Tools | Architecture | Show Project Diagram menu. The project dependency diagram follows your solution structure, and starts by showing all top-level items in your solution.

In this particular solution, I have some solution folders (src, tests, samples), so those will be shown by default. Double-clicking an item in the diagram will expand (or collapse) its child items. In the Project Diagram tool window, you can also select which projects (or solution folders) should be visible.

A first look at the Project Dependency Diagram in Rider

Have a look at the various context menus and toolbar icons, and try zooming/panning the diagram. Blocks in the diagram can also be moved around. Using the context menu, you can enable a grid (and the snap to grid option, if needed), so you can organize the project dependency diagram to your liking. You can also add notes to annotate certain projects.

Annotate diagrams with notes

From the toolbar, you can export the diagram as an image, and include it in your documentation. Or print it and hang it on your team room wall!

Navigating the Project Dependency Diagram

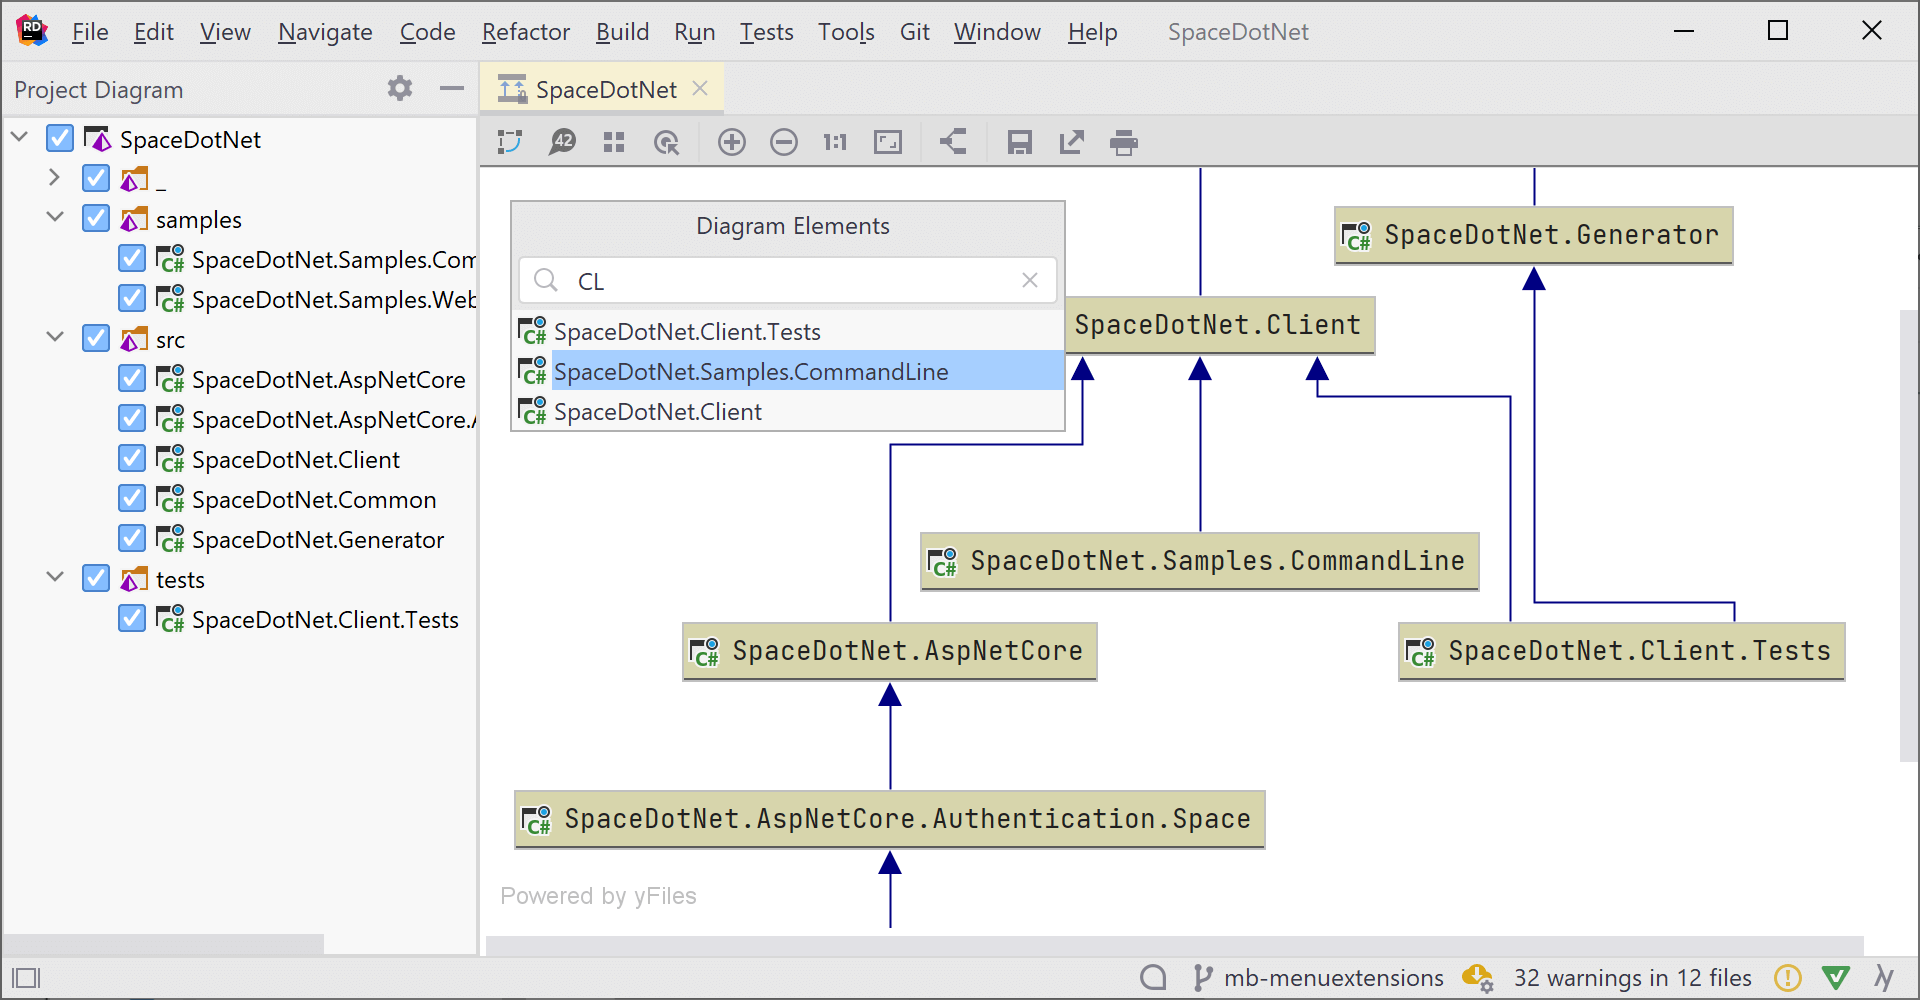
It is possible to navigate to a given project and position it at the center of your project dependency diagram. Use the Ctrl+F on Windows or Cmd+F on macOS, and find the project you want to focus on.

Find diagram element

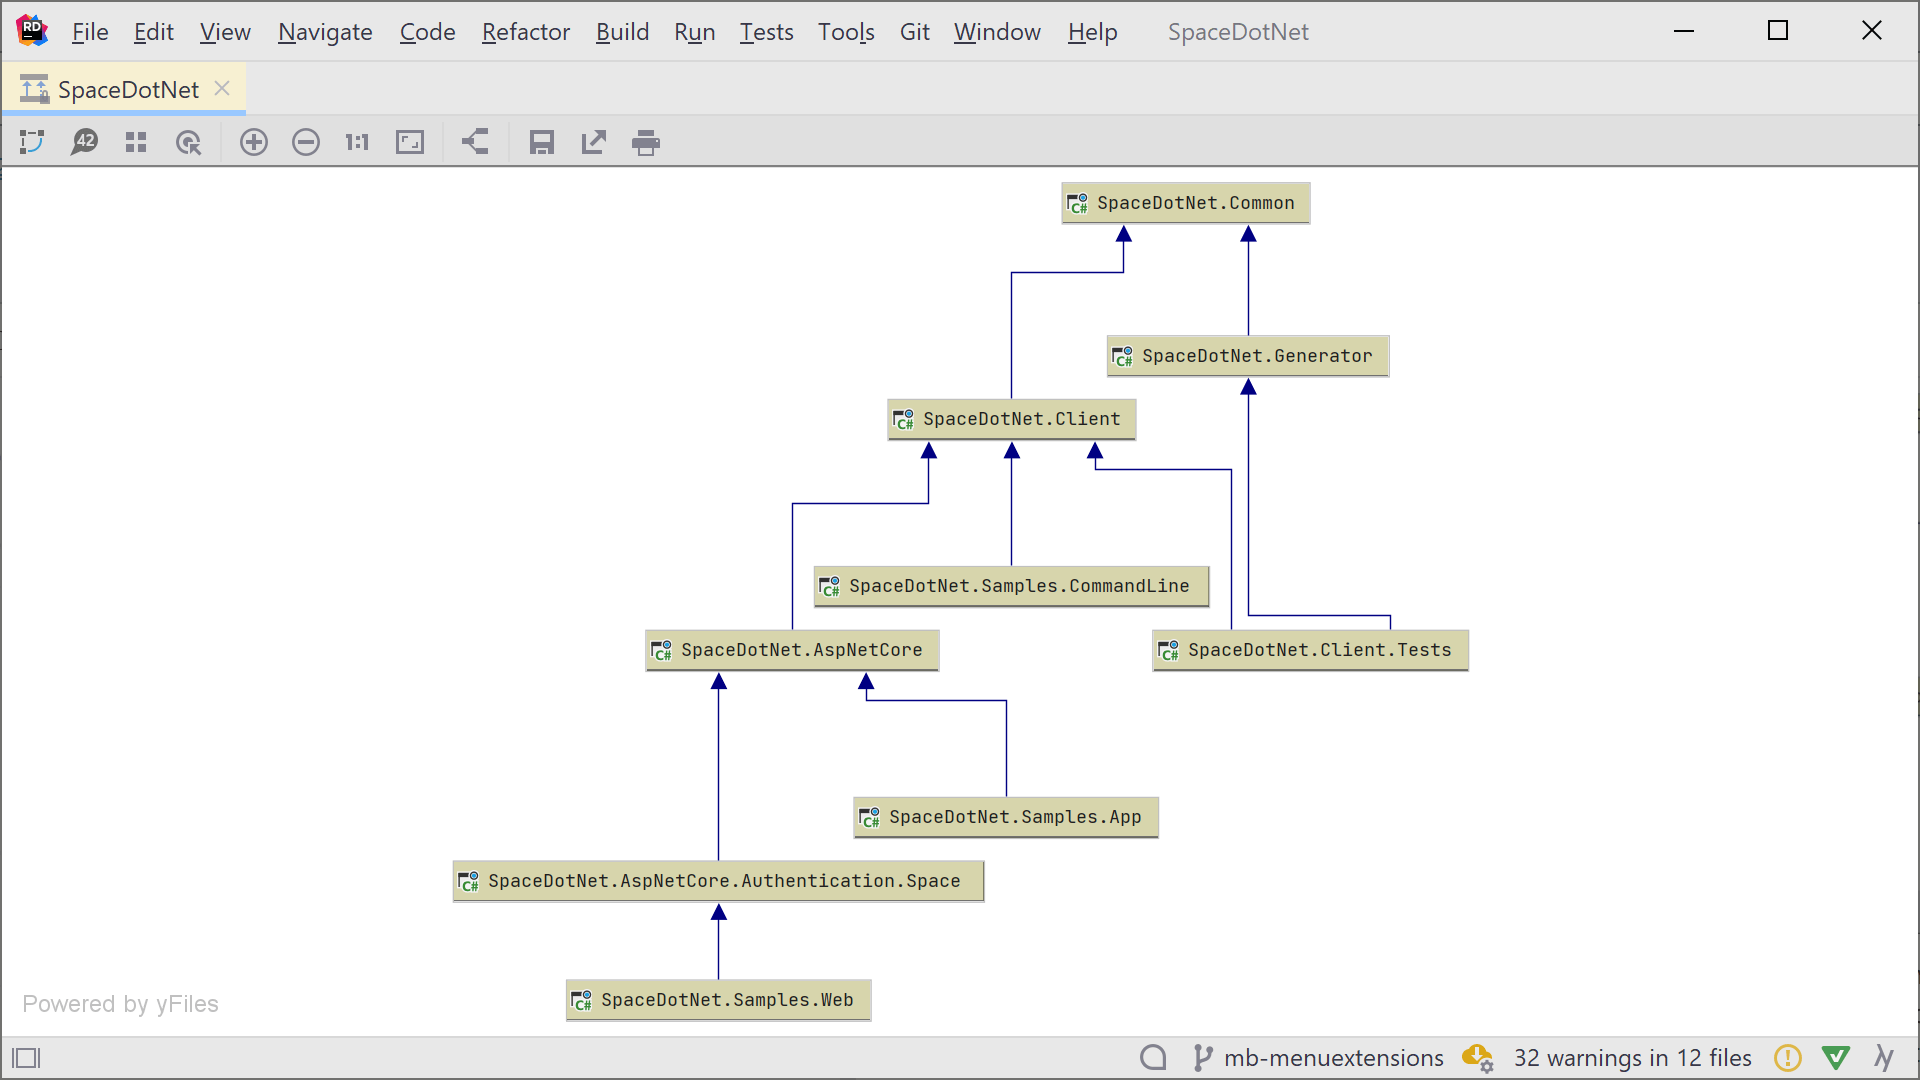
The Show Neighbours of Selected Nodes toolbar button filters the project dependency diagram to the selected node, its direct dependencies, and the projects that depend on this project. For example, after clicking SpaceDotNet.AspNetCore, the diagram will be filtered to the projects that reference this project, and its direct dependencies.

Show Neighbours of Selected Nodes

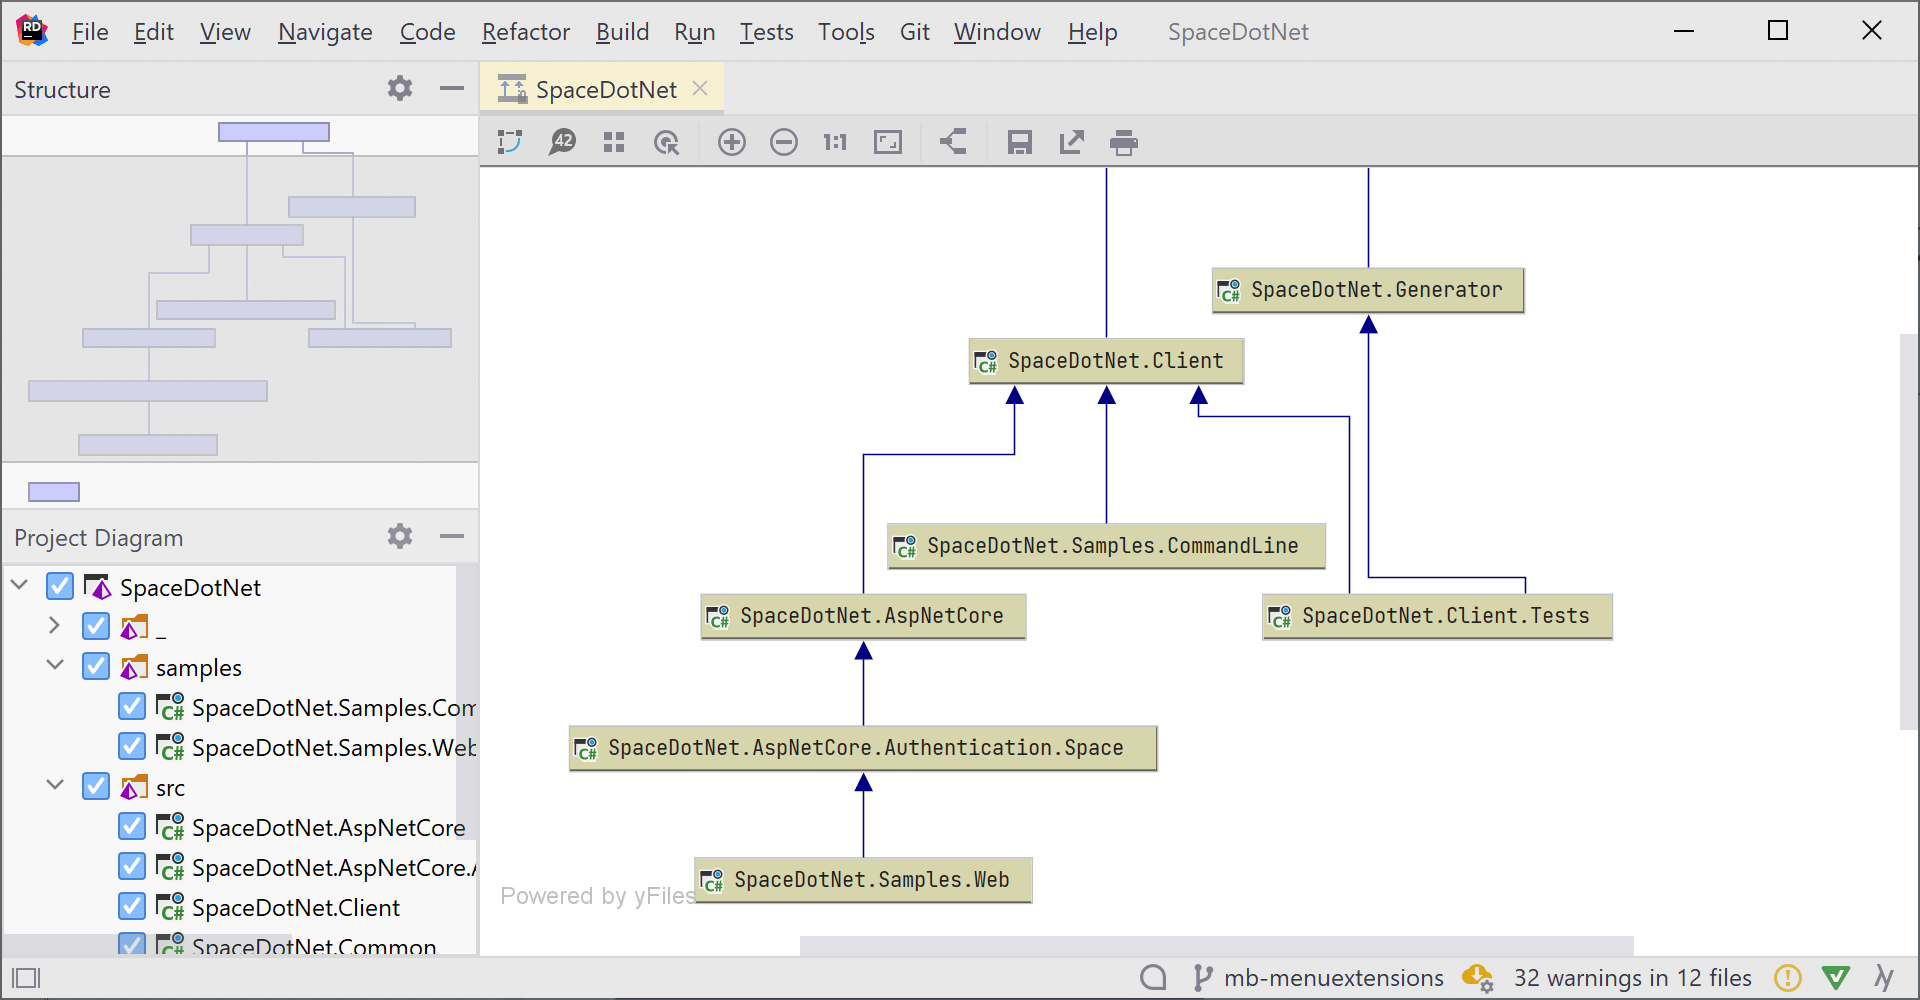
For large project dependency diagrams, you can open the File Structure tool window (Ctrl+Alt+F in the Visual Studio keymap) and pan around using a high-level overview.

Pan around using the File Structure tool window

Analyze coupling between projects

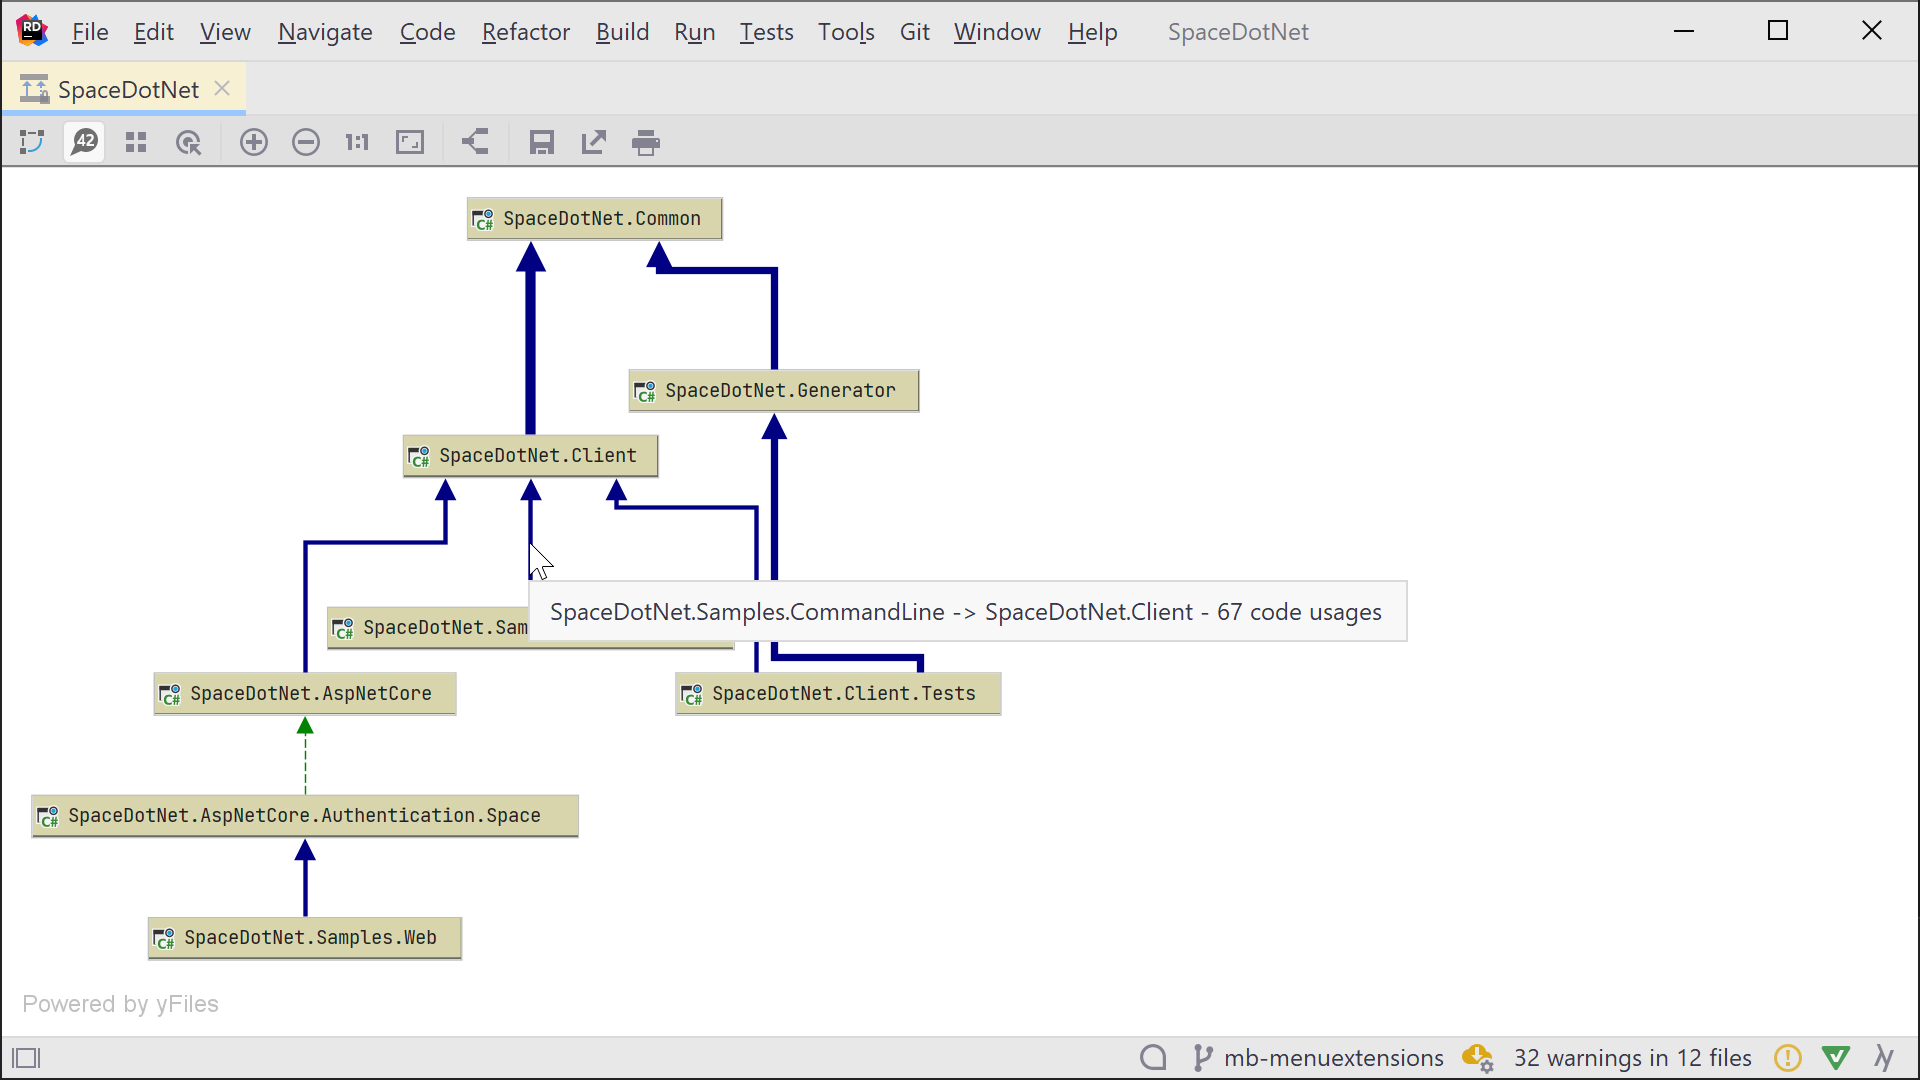
A project dependency diagram helps you analyze coupling between projects. When you click the Enable Coupling Analysis icon in the toolbar, Rider will perform additional analysis and update the diagram. The thickness, color, and style of the links may change, depending on how tight the coupling between projects is.

Diagram arrow thickness and style

A solid link means compile-time references exist between two projects. The thickness of the link gives you an idea of how many usages exist. The more usages exist, the thicker the link will be drawn.

Dotted links are drawn between projects that have no compile-time usages.

When in doubt, hover the link. Rider will display a tooltip with the exact number of usages. Clicking the link will gather details about dependent code, and show them in a separate tool window.

Analyze coupling between projects

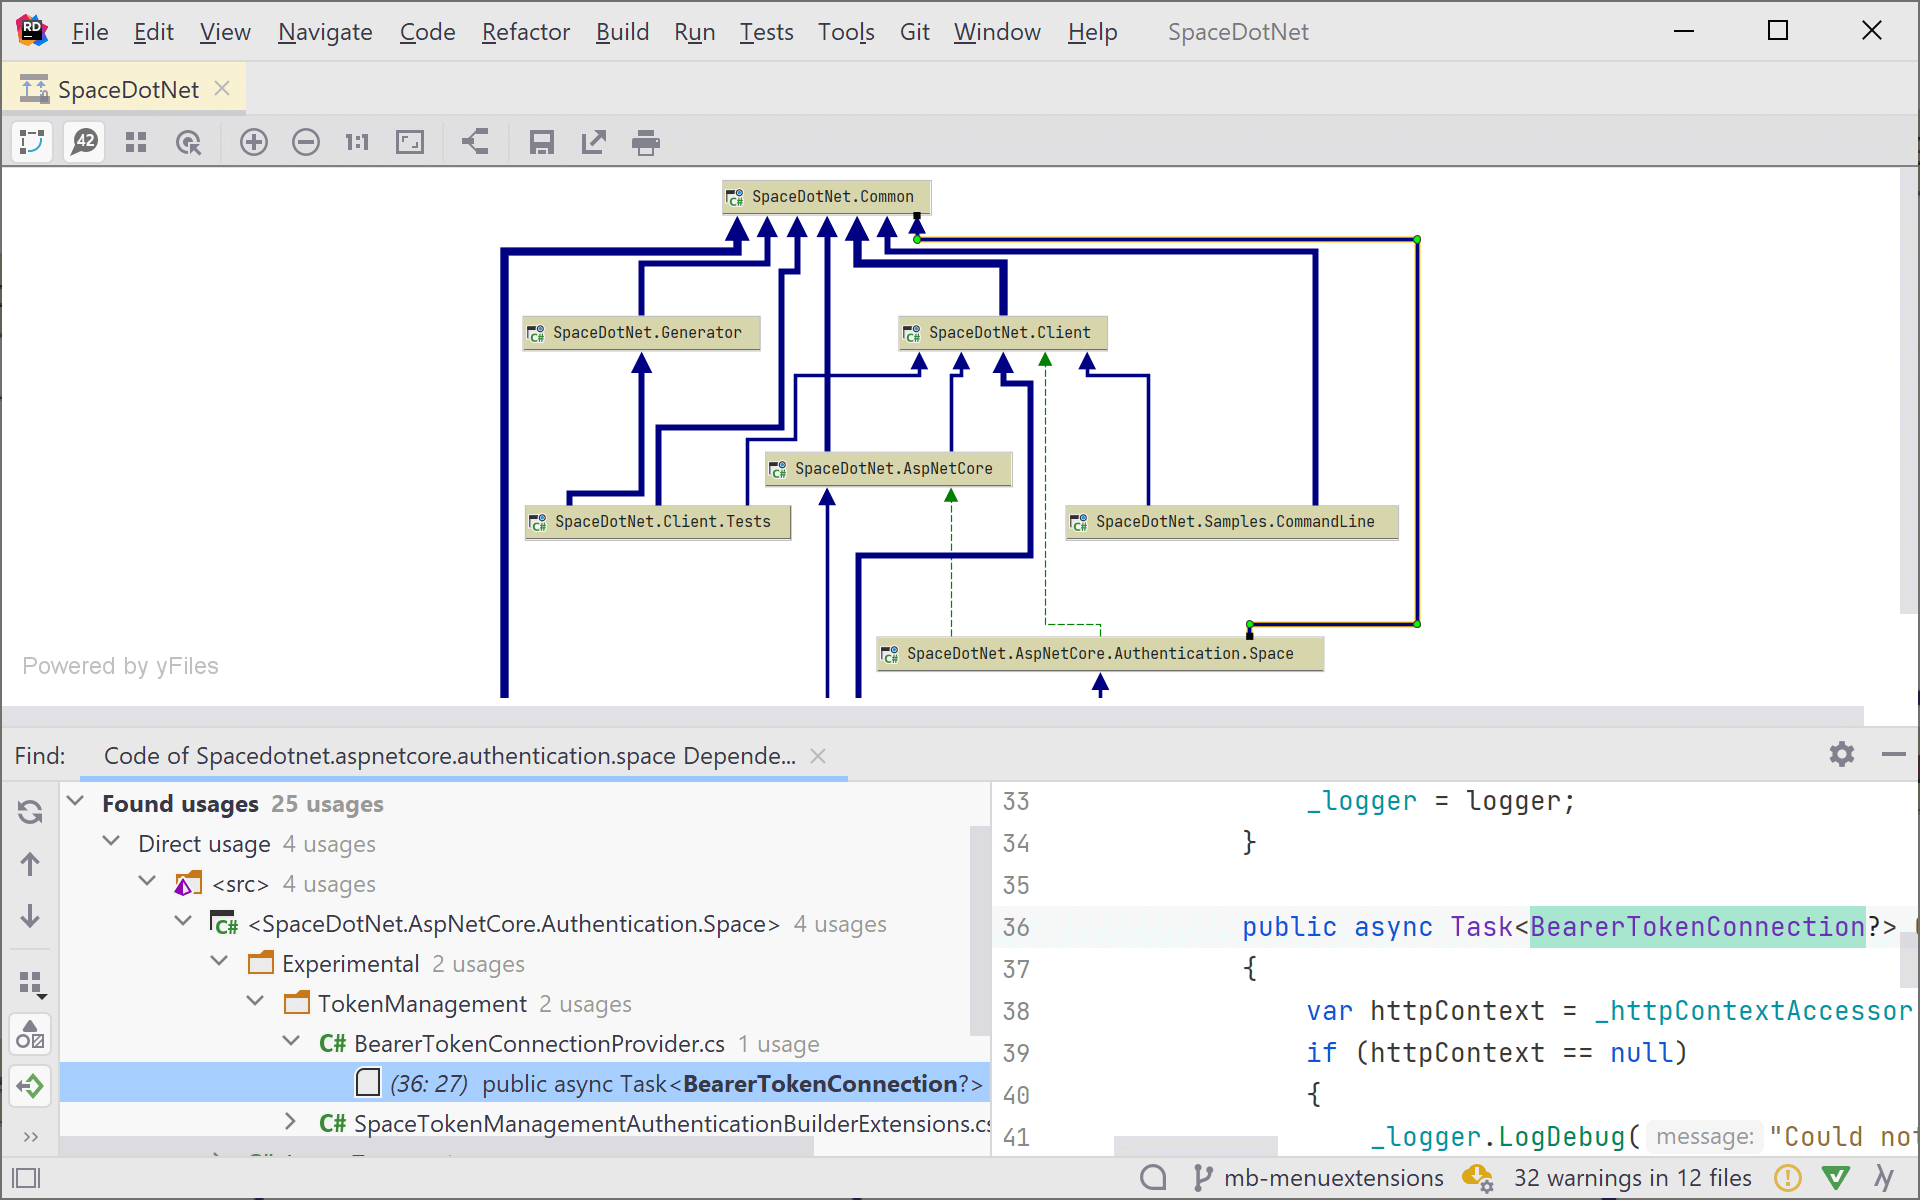
In a project dependency diagram, you can also Show Transitive Dependencies. This will render not only direct project dependencies, but also indirect dependencies. In the following diagram, the SpaceDotNet.AspNetCore.Authentication.Space project has no direct reference to SpaceDotNet.Common, however, it does have a transitive dependency. When clicking the link, you can see that we are using types from SpaceDotNet.Common. It could be a good idea to make this an explicit project reference after all.

Uncover transitive dependencies that should be explicit

Note that for large solutions, building the dependency diagram and calculating code metrics can take some time.

Compare saved snapshots with the current solution

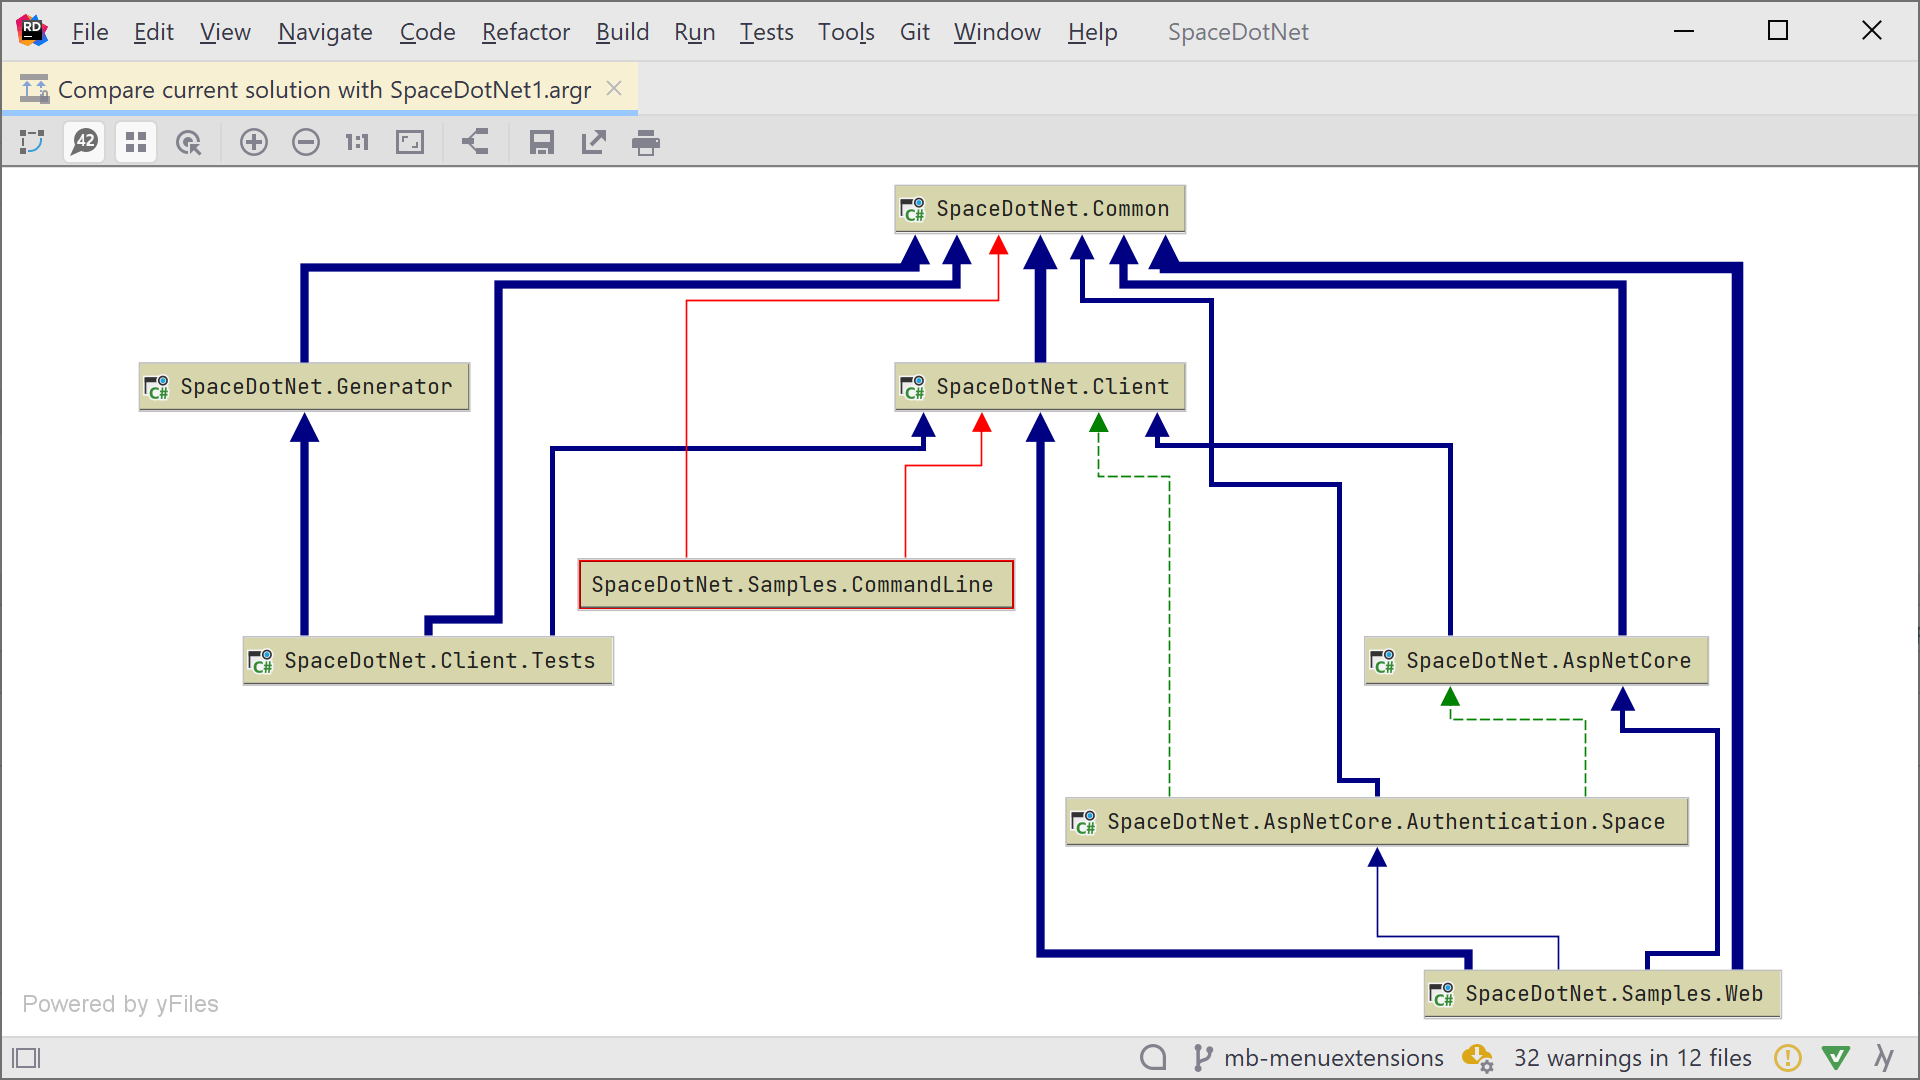
From the toolbar, you can save a project dependency diagram for future use. Using the Tools | Architecture | Compare With Saved… menu, you can load and inspect previously saved snapshots. If your solution’s current project dependencies are different from the saved diagram, Rider will show those differences. This helps to keep track of the evolution of dependencies in your solution.

Keep track of evolving dependencies

Feedback

We’ll be releasing Project Dependency Diagrams in Rider 2020.3. While you can use it in the early access previews of Rider already, we’re still polishing this new feature. If you run into any issues, we welcome your feedback in this issue.

Download Rider 2020.3 EAP and give it a try!

Build Serverless Apps with Azure Functions

$
0
0

Azure Functions is a cloud technology from Microsoft. It helps individuals and companies from startups to mega-corporations, since they all have these few things in common:

  • Code that doesn’t fit into traditional or popular application architectures.
  • Code that must run based on some event that happens.
  • Software that must integrate with other software.

And this is where Azure Functions can help. So in this blog post, we’ll review what Azure Functions are and how they can help you, as well as demonstrate the basics of building an Azure Function app.

Azure Functions Overview

An Azure function is just that – a function. A single unit of work. The difference between an Azure Function and any plain old function from any language is that Azure Functions run in the cloud, and a single function can be treated as a deployable unit. Multiple functions can be bundled into an Azure Functions App and deployed as a unit as well.

There are many usage scenarios for Azure Functions that make it a better choice than traditional application architectures. Let’s take a look at some examples:

  • A lot of software does ETL batch processing on a scheduled basis, such as uploading Excel files, running some business rules against that data, then ultimately storing it in a SQL or other type of database.
  • Every company has at least one extremely small application that does only one specific thing. This could be something like a time-keeping utility, where employees log their time on their phone, and an Azure Function sends the data off for processing.
  • Quite a bit of software is complex and would benefit from a microservice-style architecture. These apps often integrate with other applications. Some are purchased as packaged software (CRM, ERP, etc…), and others built in-house. Either way, you can integrate them seamlessly with Azure Functions.
  • Software that needs to quickly scale, or that runs sporadically. For example, event organizers that host their event once a year shouldn’t have to maintain, pay for, secure, and run the event software and hardware for several months while nobody is using it. That’s a big expense when the software is used 25% of the time. Azure Functions helps you manage everything from deployment to scaling for occasionally-used software like this.

These represent just a few common use cases that fit well with Azure Functions. Additionally, Azure Functions works well in several other scenarios.

Azure Functions Apps

There are two things you’ll need to install to get started building Azure Functions apps with Rider:

  • Azure Toolkit for Rider: The Azure Toolkit provides features to help you manage Azure assets with Rider. The toolkit installs project templates for Azure Functions. This plugin lets you download, install, and update the Azure Core Tools (see Settings | Tools | Azure | Functions). Additionally, there are many useful local development tools in the plugin such as Azurite support, Azure AD support, and log streaming.
  • Azure Functions Core Tools: These tools enable local development for Azure Functions.

Functions Apps created using Rider’s Azure Functions project template contain three files, a .gitignore, host.json and local.settings.json. Host.json is a file that contains global configuration options that affect all functions in a function app. Local.settings.json contains information about the development environment, such as logging, local connection strings, and more. Fortunately, Rider has great features to help you work effectively with JSON.

A function app provides an execution context in Azure in which your functions run. Function apps can contain as little as a single function, or as many functions as you’d like. Each function is normally represented by a single function inside of a single class and some companion configuration, that is declared in a file called function.json, or as attributes in the function code itself.

Azure Functions API

Because a function is a deployable unit, there needs to be a way to invoke it. That’s where triggers fit in. A trigger is the event that causes a single function to run. Each function in a function app has its own trigger, configured by a binding. There are several trigger types available, covering common scenarios in which you’d want to launch a function. The other bindings available are input or output. Input and output bindings are mechanisms that allow you to connect to resources, such as a CosmosDB data stores, queues, notifications or more.

Since there is one Azure Function per class (there can be many private functions), the function’s name is RunAsync. However, having several different classes with a RunAsync function gets confusing, quickly. To make the name friendly, use the FunctionName attribute.

[FunctionName("Greet")]
public static async Task RunAsync(
    [HttpTrigger(AuthorizationLevel.Anonymous, "get", "post", Route = null)]
    HttpRequest req, ILogger log)

Another attribute of importance is the output binding which specifies what resource the function should connect to. In the following example, when a value is returned – it’s not returned to the caller as would happen in a function in any given language, but into the queue that’s been defined in the attribute, as shown below.

[return: Queue("greetings-queue", Connection = "StorageConnectionAppSetting")]

Use a return statement and the .NET Framework will put the data where it belongs – in this case, the queue named greetings-queue as defined previously. This is a great way to chain resources together in Azure, for example, input via an HTTP trigger to a queue, or to CosmosDB, or both. Below is the complete function demonstrating accepting a value from an HTTP Request then adding it to CosmosDB.

[FunctionName("Greet")]
[return: Queue("greetings-queue", Connection = "StorageConnectionAppSetting")]
public static async Task RunAsync(
    [HttpTrigger(AuthorizationLevel.Anonymous, "get", "post", Route = null)]
    HttpRequest req, ILogger log)
{
    log.LogInformation("C# HTTP trigger function processed a request.");

    string name = req.Query["name"];

    string requestBody = await new StreamReader(req.Body).ReadToEndAsync();
    dynamic data = JsonConvert.DeserializeObject(requestBody);
    name = name ?? data?.name;

    return name != null
        ? (ActionResult) new OkObjectResult($"Hello, {name}")
        : new BadRequestObjectResult("Please pass a name on the query string or in the request body");
}

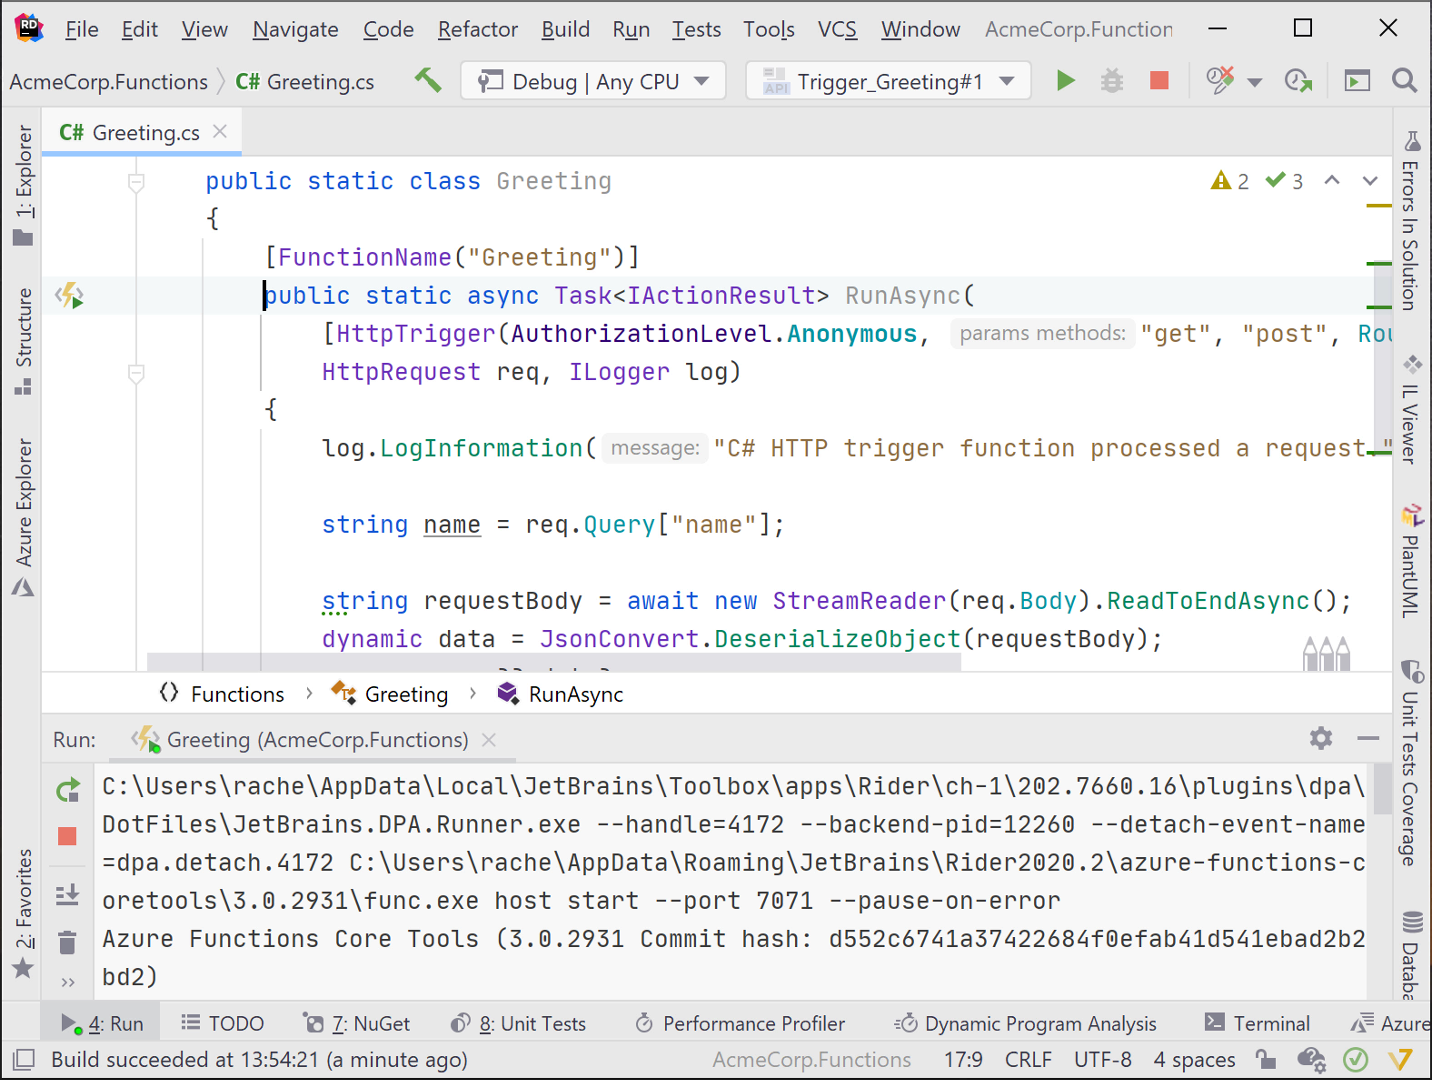
After creating a function, try it out by choosing to run or debug it. When using Debug or Run, the function executes locally, so you may need to configure some options in package.json. If you’re testing a Timer Trigger, you can easily run or debug it: there’s no need to sit around waiting for the timer, or have to change it to one second then risk commiting pushing the wrong timer settings to production. Test Timer Triggers the same way as HTTP triggered functions, with Alt+Enter or the gutter icon.

Run an Azure Function in Rider

Running or debugging a function starts the local web server and shows a link to URL in Rider’s Terminal window. If you prefer to test everything in the IDE, create an HTTP Request instead. This is a great way to keep some sample data to send in the request without having to type it in every time you test it. The easiest way to create a request is to click on the Trigger gutter icon, or use Alt+Enter. Alternatively, you can right-click in the Solution window and choose Add | HTTP Request. This adds an .http file that you can place commands in, then run those commands with Rider’s built-in tooling.

Use an HTTP Request to test a function

Manage & Deploy Function Apps

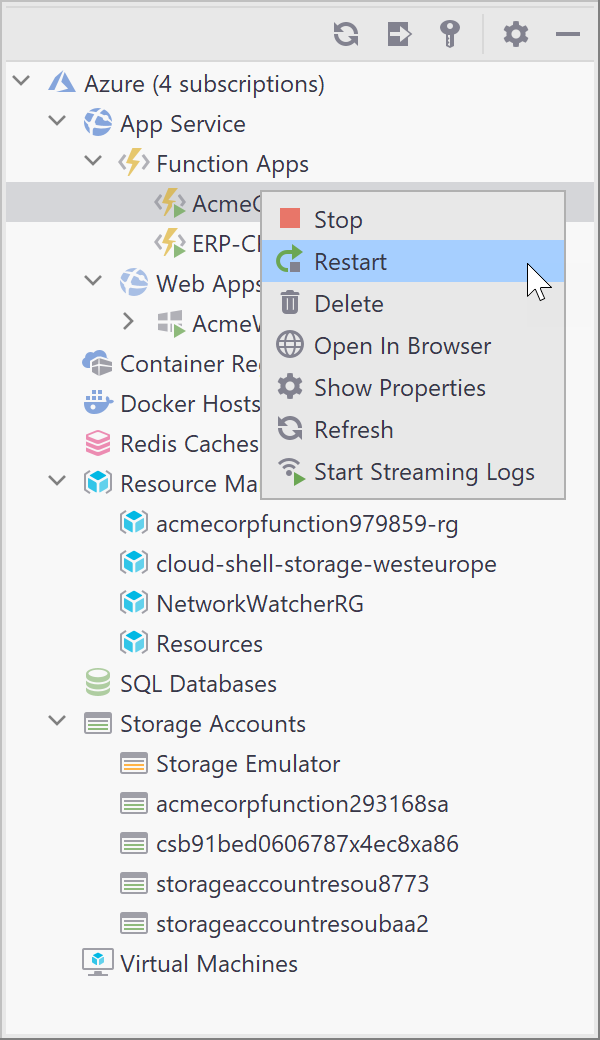
Because the Azure Toolkit is a Rider plugin, you can use it to manage Azure assets such as function apps, storage accounts, app services, docker hosts, and more. Choose Azure Explorer from View | Tool Windows, then right-click on the various nodes in Azure Explorer to reveal context sensitive options for managing assets.

Manage Azure assets with Azure Explorer

Alternatively, if you prefer the keyboard or scripts over point and click the Azure Cloud Shell is available through Tools | Azure | Start Azure Cloud Shell.

The Azure Portal is Microsoft’s online tool for managing cloud resources. You may find yourself using a combination of Rider’s Azure Explorer, the Azure CLI, and the Azure Portal, depending on your needs.

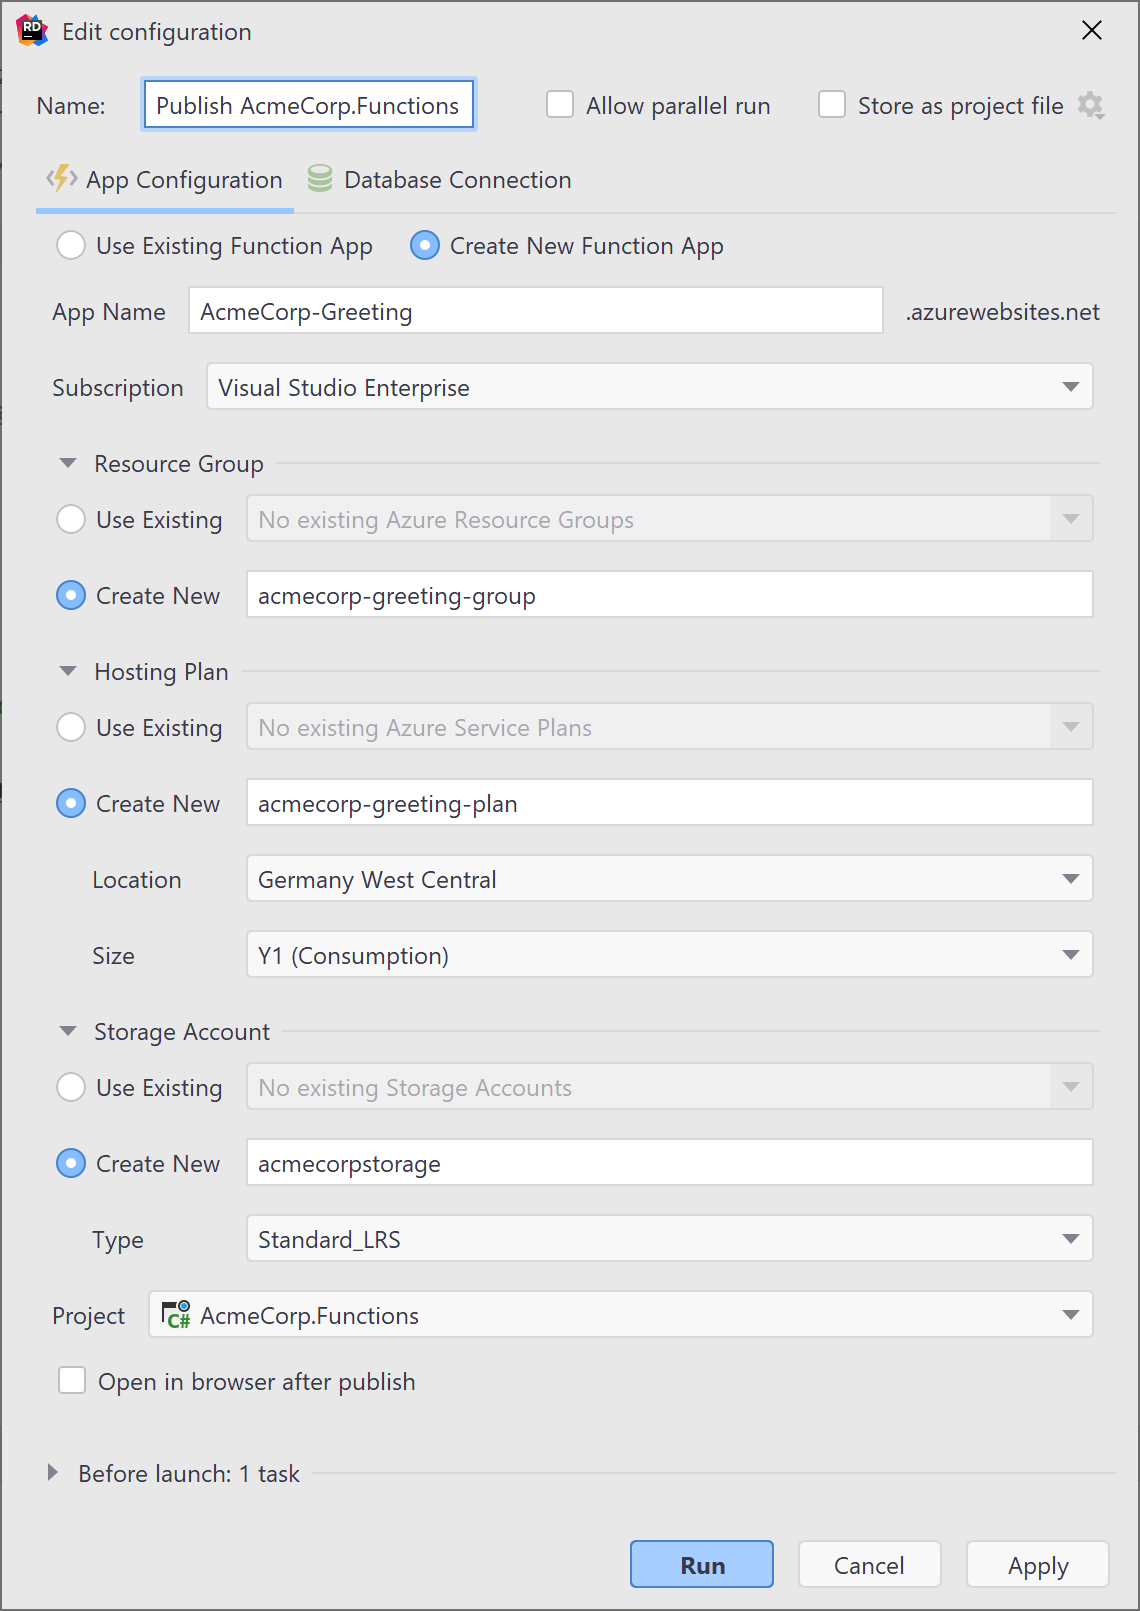
When you’re ready to deploy, go ahead and right click in the Solution Window and choose Publish | Publish to Azure. Choose an existing app to publish to or enter the required information for Azure, such as subscription and storage options, resource groups, hosting plans and other information.

Publish your function to Azure

Conclusion

Azure Functions is a cloud-based technology that enables you to work seamlessly with integrated data, as well applications outside the boundaries of traditional app structures. Building serverless apps with Azure Functions? Let Rider help you achieve your goals, and let us know about your experience!

.NET Annotated Monthly | November 2020

$
0
0

In 1995, Microsoft shipped Internet Explorer 2.0. Do you remember browsing the internet in 1995? According to Internet Live Stats, there were about 23,500 sites. That’s all there was, and Geocities was one of them. By today’s standards, most of those 23,500 sites were aesthetically awful. Later, in 2004, Firefox entered the scene to compete with IE. Web developers everywhere are familiar with its famous F12 dev tools.

.NET Annotated Monthly newsletter by JetBrains!

.NET news

There’s not a whole that happened in the past month, but the great news is that .NET 5 is almost ready.

.NET tutorials and tips

What is the difference between NET Core, NET 5 and NET Framework? – Thank you, Kathleen Dollard for answering this question! It’s been confusing developers for quite some time now. So folks, now you know.

Stop doing IsVisible=“true/false” to Show/Hide Views in RunTime in Xamarin Forms – I don’t know how many times I’ve seen this antipattern, and Charlin Agramonte shows us all how to avoid it in XAML UIs.

Test Series: Part 1 – Understanding Testing Strategies
Test Series: Part 2 – Unit Testing – Jason Farrell delivers a 2-part series in which he deep dives into everything you need to know about unit testing.

Mind Your Strings with .NET 5.0 – Things don’t always work when you upgrade. Jimmy Bogard fights with string things upon his upgrade to .NET 5, so you don’t have to.

Setting the command timeout with the latest .NET SqlClient – Erik Ejlskov Jensen lays out a short and sweet way to set that timeout.

Getting started with GraphQL and HotChocolate – Cecil Phillip hosts Michael Staib in this video about getting started with GraphQL and HotChocolate. Michael is the author of HotChocolate.

Generate QR Codes With C#
Use ASP.NET With Turbolinks 5 – Khalid Abuhakmeh teaches a few awesome tricks this month, including generating QR codes with C# and Turbolinks, so folks feel like they’re using a SPA app but without having to change the backend.

.NET Core with NGINX on Linux – I’ve been telling you .NET development on Linux is a thing! For real! Check out this awesome tutorial on how to run .NET Core with NGINX on Linux by Irina Scurtu.

A Highly Biased Review of C# Changes from Version 1.0 to 9.0 -I love highly biased blog posts! Because it’s the challenges that developers face that form those opinions and biases, and there’s always something to learn. So read this one on C# by Matthew MacDonald.

Why does it take so long to build software? – Justin Etheredge lays out the facts of what it is about software that takes so long to built it.

C# in Simple Terms – Inheritance and Polymorphism – Back to basics with Matthew Jones, discussing object-oriented techniques.

A tour of the .NET functions framework – Functions as a Service? Why not! Jon Skeet blogs about how to make that happen in Google cloud and .NET.

Improve your developer skills – Check out this collection of short videos by Claudio Bernasconi, helping you to sharpen your skills.

Should I learn a functional language (F#) – James Hickey and Derek Comartin discuss this ever interesting question that most .NET developers have asked themselves. Or at least I hope so. To be a better developer means that we should be looking to expand our programming skills, and languages from a different paradigm do just that.

Free eBook! Unit Testing in .NET: The Complete Guide – Who doesn’t just love free eBooks? Mihail Vladov has published this great book on unit testing for us.

Interesting and cool stuff

The Principles Of Visual Communication – UXs in apps don’t just display and retrieve information. They communicate. And your apps need to tell a story, or communicate key thoughts to the users in a clear and concise manner. Elizabeth Lin demonstrates the principles you need to make your UXs really work for the user.

How JavaScript became a serious programming language – JavaScript has taken over. There’s no denying it. But how, you may ask? Nimisha Mukherjee is here to tell us.

It’s past time to ditch VB6– I’ll just go ahead and stir the pot with this one. 😀

And here I thought the 2 hard problems in computer science were cache invalidation, naming things, and off-by-one errors.

Can you imagine if developers named children like they do variables? How would grammar school teachers even deal with temp, temp2, temp3, and so on?

And finally…

Here’s a chance to catch up on JetBrains news that you might have missed:

Blog posts:

Webinars!

Check out this fantastic offer! CODE Magazine is offering a free subscription to JetBrains customers!

If you have any interesting or useful .NET or general programming news to share via .NET Annotated Monthly, leave a comment here, email me at rachel.appel@jetbrains.com, or drop me a message via Twitter.

Subscribe to .NET Annotated!

Run Blazor Apps Within Electron Shell

$
0
0

Hi-diddly-ho Blazorinos! A long-lived mantra of the .NET community has concentrated on transferable knowledge of C# into different paradigms, including desktop, mobile, web, and embedded systems. Blazor continues that trend of using what we know to build new and exciting solutions. Blazor has recently garnered a lot of buzz in our industry, focusing on bringing C# programming to frontend HTML experiences.

In this post, we’ll go one step further and see how we can embed Blazor into an Electron app to ship Blazor on the desktop. We’ll also look at how we can debug our Electron application using Rider.

(more…)


Diving Into NuGet History For Fun and Community Insights

$
0
0

In the dark ages of .NET, developers had to crawl the internet for dependencies, run installers, create bloated lib folders, and possibly introduce assemblies into the Global Assembly Cache. Gross! Those who remember will agree it was terrible, but it’s better now!

We can all breathe a deep sigh of relief knowing that package management is central to most modern technology stacks, including our beloved .NET. Today, most developers instinctually reach to the catalog of packages on NuGet to solve mundane to difficult problems. That’s a good thing, but easy access to solutions also can lull us into taking our community for granted.

In this post, we’ll look at our .NET community’s history through the lens of NuGet data harvested using Maarten’s Azure Functions-based metadata crawler, which produced 2.7 million records and a 1.5GB comma-delimited text file. We loaded the data into Elasticsearch and utilized Kibana to make a dashboard, which you’ll see later in this post.

APIs, data points, and structure

As of writing this post, there is no way to get a singular database of NuGet information. Folks looking to recreate this post will need to crawl the NuGet APIs made available to everyone. Again, Maarten’s Azure Functions-based metadata crawler is a great place to start.

At first, retrieving the data had us worried. NuGet is a critical community infrastructure that everyone relies on working. Having multiple community members coordinate millions of API calls at the same time could damage NuGet’s ability to deliver responses to clients. That said, we were given the “unofficial” go-ahead by NuGet team members to use the APIs.

For our data, we only retrieved publishing information and not consumer information. For example, Amazon has published the AWSSDK.APIGateway package over 396 times since its first release. Amazon’s release cycle is tame in comparison to other libraries. Paket, a popular package manager client, has published its packages over 2,413 times!

While the NuGet API does expose download counts, it’s cumbersome to gather this data for all packages. There is an open GitHub issue about exposing download counts in an easy-to-consume manner, but given the already enormous breadth of information, we decided against download counts (for now).

The information we were able to retrieve for published packages includes: Package Id, Tags, Authors, Version, License, Publish Date, and Target Frameworks. Each record in our database is for a package version, helping us understand any particular package’s publishing frequency and lifespan.

Assumptions

We need to get a disclaimer out of the way before we start looking at information.

First, we’re making assumptions about folks appropriately tagging packages – likely a significant portion of publishers are not. Lack of tags could mean the results are incomplete. Additionally, while we can compute narrow slices based on tags, authors, and time frames, it gets harder to do larger wedges of data. The computation overwhelms the compute engine.

Additionally, this post is about data. We’ll try not to assume anything about the state of .NET, OSS, or any other conjectures.

So let’s get started by looking at some data.

Started from the bottom…

*If the dashboard images are too small, use the context menu to open the images in a new tab.

All great things have humble beginnings, and NuGet is no different. On January 7th, 2011, David Bryon published Agatha-rrsl to the NuGet registry. The first NuGet package, followed almost 1 second later by a flood of packages. On January 7th, 177 publish events, and publishers added 155 unique packages to the ecosystem.

Authors on that day include the Codeplex Foundation, Google, and Microsoft. Significant tags include aspnetwebpages, mvc, t4, and mocking. Seeing that ASP.NET MVC is one of the first projects to be open-sourced by Microsoft, it’s no surprise to see it amongst the first packages released.

Some folks may be wondering what sl3 and sl4 mean regarding target frameworks. Well, that’s Silverlight, the discontinued web version of .NET. Don’t worry though, many of the lessons learned from Silverlight found their way into .NET Core and .NET 5.

From those small yet significant beginnings, we now have 229,336+ unique packages on NuGet.

Now we’re here!

Let’s look at the publishing of unique packages from the last 30 days. We’ll see a clear pattern emerging as compared to the first day of NuGet packages.

The consistent pattern would likely be due to advances in continuous build and deployment processes. Products like TeamCity, AppVeyor, and GitHub Actions help developers ship consistently even for minor changes.

Looking at a complete picture of the last 30 days, we can see service providers have been busy pushing commercial packages to NuGet: Amazon, Google, Microsoft, Uno Platform, and Syncfusion. Amazon has an overwhelmingly large lead in the tag count, with aws being present over 3,000 times.

What’s also interesting here is the target frameworks tag cloud. The target framework netstandard2.1 looms large over other versions. While still present, the market share for legacy .NET is relatively smaller. We can see that net50 begins to appear as developers start to support the new version of .NET.

❤️ JetBrains loves OSS

It wouldn’t be any fun unless we looked at what JetBrains has done to support .NET OSS. For this section, let’s look exclusively at the jetbrains author, which does not include individual JetBrains employees’ contributions to the ecosystem.

JetBrains has contributed 44 unique packages to NuGet, with a primary focus around our .NET tools like ReSharper, dotMemory, and dotCover. We also ship .NET packages to support our other product offerings, such as YouTrack and TeamCity. What’s visible in the dashboard above is our unique versioning approach, which uses years to denote the current release. For example, you’ll see the version prefix 2020.*.* used frequently this year. What’s also amazing is that JetBrains has been part of the .NET OSS ecosystem for over eight years.

ASP.NET community

Next, we were curious, outside of Microsoft, who in our community contributes the most to the tags aspnet and aspnetcore. Here is where things get interesting, as we see our Asian friends contributing a good portion of the 2,890 packages to the ASP.NET ecosystem.

Developers in China make up 50% of the packages with the aspnet and aspnetcore tags. Chinese is likely an uncommon language for native English speaking developers, so these packages are less frequently used outside of China. These publishers are using the tag applicationframework heavily, which leads us to think many of these packages are part of a philosophical approach to building web applications.

One of the framworks we found in this data is China .NET, with an extensive set of documentation. This framework has all kinds of utilities tied in, such as an alternative for AutoMapper.

All this makes us wonder what other sub-cultures can be uncovered simply by looking at NuGet’s data?

Xamarin development

Xamarin is a cross-platform approach to building mobile applications targeting operating systems like iOS, Android, UWP, and many more. Let’s see what the search query of tags: xamarin* returns.

The mobile ecosystem is healthy and alive, with a head-spinning 6,393 packages. The trajectory of growth from 0 to over 3000 published packages in a given timeframe is impressive. Additionally, what’s different about mobile development is the support for varying target frameworks, which almost borders on the absurd.

Here’s the complete picture for the Xamarin community.

Not C-Sharp

It’s hard to argue against C# being the dominant language in the .NET ecosystem, but that’s not to say that F# and VB.NET developers don’t love and champion their languages. Let’s take a look at the two sibling languages and their contributions to NuGet. Let’s start with F#. We’ll filter our results using the tag fsharp.

What stands out immediately with the F# dashboard is its continued publishing momentum. This momentum is even more astounding, as it is driven mostly by community members, with Ryan Riley contributing a whopping 21.96% of unique packages.

In the last 30 days, the F# community has focused on releasing Fable and Fantomas. We recently invited core contributor Florian Verdonck to give a talk about Fantomas to JetBrains .NET Days attendees.

Well, what about VB.NET? Let’s filter by the tag of vb and vb.net and see what we get.

We can see that the Visual Basic packages come from software vendors like Evo PDF Software, HiQPDF software, and ComponentPro Software. Seeing VB.NET has a following in enterprise development circles, it makes sense to see more business-focused packages.

Licenses

The data we have is a little sparse when it comes to project licenses. The NuGet spec allows folks to set their license URL, which makes determining the precise value difficult. For this section, we relied on a keyword in the URL string itself, so take this data with a healthy dose of skepticism. For example, if the license URL contains MIT, we assume the project has chosen the MIT license.

Looking at the packages, we see that the MIT and Apache licenses are the most commonly specified. The Custom license could contain MIT, Apache, and BSD variants, but we chose not to follow the URLs to determine the exact values. We also see many publishers leave the license URL value empty altogether, which can be problematic for consumers trying to choose a legally-usable package.

Conclusion

We’ve just started to scratch the surface around the NuGet ecosystem. Sometimes trends are self-evident, and other times we need to have a starting point to query further. Like we mentioned at the start of this post, this information is publisher only, giving us an exciting yet admittedly incomplete picture of our community. What was most exciting to see is the broader .NET community’s sub-cultures, programming languages, platforms, and geography.

If you folks have any interesting questions you’d like to see answered by this data, please leave a comment below. If you see something in the information we missed, again, we’d love to hear from you. Thank you for reading, and please share this post and discuss it with your developer friends.

Source Generators in .NET 5 with ReSharper

$
0
0

One of the most exciting features in .NET 5 and C# 9 are source generators. They enable us to hook into the compilation pipeline that is executed for our projects, analyze source files that are to be compiled, and provide additional source code for our final assembly. In other words, we can take advantage of compile-time metaprogramming!

Are you performing expensive reflection operations? Do you need to write a lot of boilerplate code like route mappings or builder methods? Source generators can make our lives a lot easier with these and many more scenarios that are yet to be discovered!

A source generator must be attributed with the Generator attribute and implement the ISourceGenerator interface. More detailed examples can be found in the source generators cookbook. In its most rudimentary form, we’d start with the following:

[Generator]
public class MyGenerator : ISourceGenerator
{
    public void Initialize(GeneratorInitializationContext context)
    {
    }

    public void Execute(GeneratorExecutionContext context)
    {
    }
}

Internally, Roslyn treats source generators like analyzers. What’s interesting is that they’re also packaged the same way.

A source generator has full access to the syntax trees and the semantic model, i.e. the Compilation object. A common approach for source generators is to use partial classes and marker attributes, however, we’re by no means limited to this! It is important to note though, that source generators won’t stack. Each will see the original set of source files, so code generators are oblivious of other code generators. Also, they can’t change existing code, so they’re not a replacement for AOP frameworks like Fody or PostSharp.

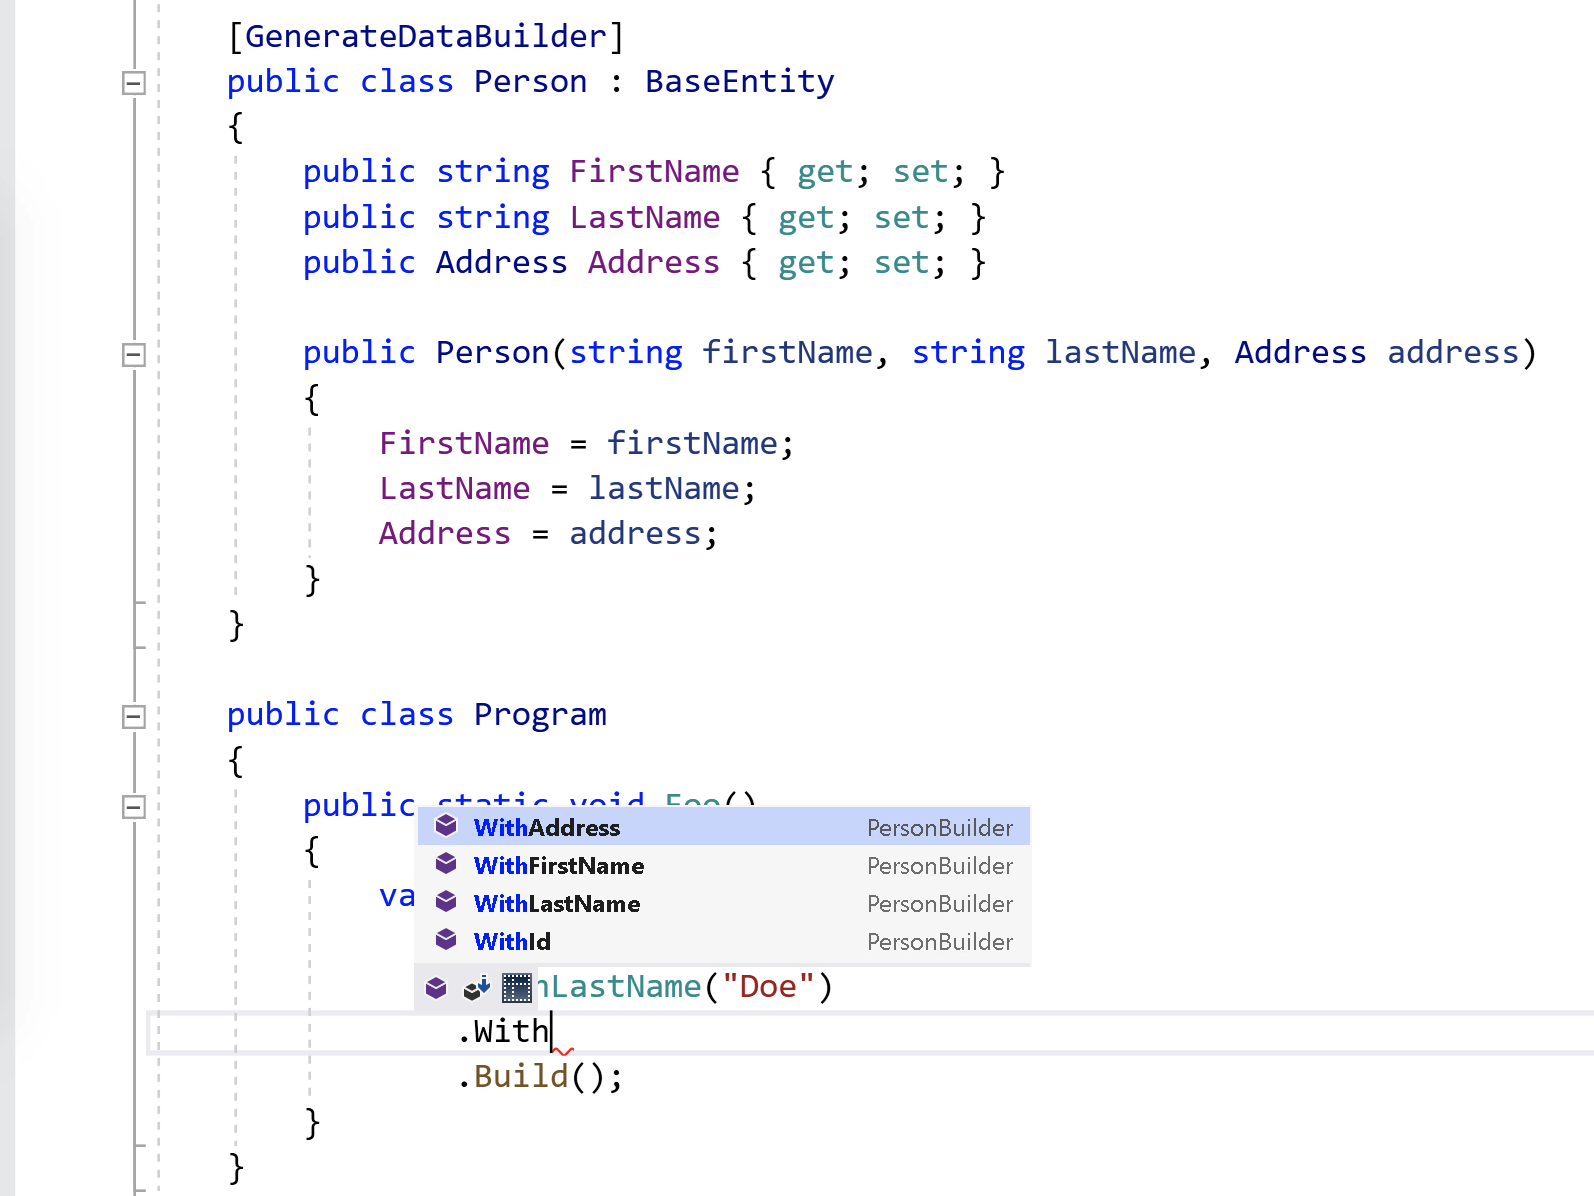
One of the crucial aspects of source generators is the IDE integration. As we write code, we should have immediate access to the code generated by source generators. For instance, when we use the Data Builder Generator by Martin Ullrich, the generated builder methods should be accessible from our project right away.

With ReSharper 2020.3 EAP 5, the additional code is read from the Visual Studio workspace and then included as in-memory source files into our code model. This allows ReSharper’s code completion to function as usual:

Source Generators in ReSharper

If you’re curious about the generated code, you can always navigate to a generated symbol, i.e. the in-memory document! Since source generators can output multiple additional source files, you might also consider writing the complete generated code to disk. This is possible by setting two properties in your C# project file (requires .NET SDK 5.0.0-rc.2 or higher):

<EmitCompilerGeneratedFiles>true</EmitCompilerGeneratedFiles>
<CompilerGeneratedFilesOutputPath>$(BaseIntermediateOutputPath)\GeneratedFiles</CompilerGeneratedFilesOutputPath>

In preparation for this blog post, I did a pair-streaming session with my friend Martin, in which we explored setting up source generators in more detail. At the end of the session we’ve created an initial draft of a generator that creates mocks and the SUT for unit tests. Feel free to reach out if you have any questions, and let us know how you feel about source generators as a consumer!

Happy generating! And try out the latest EAP’s of ReSharper and Rider.

Working With Uno Platform And Rider

$
0
0

Today we would like to share with you a special guest post from our friends over at Uno Platform. They have been working hard on bringing a first-class cross-platform experience to .NET developers everywhere. This post was originally writen by Kenzie Whalen-Dunn.

With the release of Uno Platform 3.0, developers can now create multi-platform applications for desktop, mobile and web apps using Rider.

For those new to Uno Platform – it enables for creation of pixel-perfect, single-source C# and XAML apps which run natively on Windows, iOS, Android, macOS, Linux and WebAssembly. Uno Platform is Open Source (Apache 2.0) and available on GitHub.

This article will walk through setting up Rider for Uno Platform development, cloning a real-world Uno Platform app and running on WebAssembly, Android, and iOS.

Prerequisites

Folks trying out Uno Platform will need Rider 2020.2 or higher, and the necessary Rider Xamarin Android Support Plugin. A macOS or an iOS compatible device is optionally needed to run the iOS target project.

Cloning the Uno Ch9 repository

Ch9 is a real-world demo app built with Uno Platform, currently available on Android, iOS/macOS , Windows and WebAssembly. It uses the publicly-available video feed from Microsoft’s Channel 9 for content. It is currently available in App stores and it is also open source to help developers learn from its implementation.

CH9 apps running multiple places

First step is to get the Ch9 app in all it’s glory on your local machine – use the open source GitHub repository: https://github.com/unoplatform/Uno.Ch9

Having cloned the repository, you should now see a solution with six projects, a shared project that holds our application logic and XAML views. Additionally, we have a project for each target device Uno Platform supports: Android, iOS, macOS, UWP, and WASM.

ch9 solution with 6 projects

Now we’re all set up to run the Ch9 app in all it’s glorious cross-platform glory!

Running on WebAssembly, Android, and iOS

We’ll start by building and running the newest addition to the Uno Platform family, WebAssembly, also known as Wasm.

Wasm is a format for running compiled code within a stack-based virtual machine. Some of those clients include web browsers like Google Chrome, Microsoft Edge, and Apple’s Safari. Wasm gives developers the ability to take their Uno Platform applications and deliver it to the broadest audience on the planet, web-client users.

The Ch9 solution has multiple run configurations. To run the Wasm project, you need to set the startup project to Ch9.Wasm and Debug | Any CPU.

rider wasm run setup configuration

We can also use the Ctrl+Alt+Shift+R keyboard shortcut to switch between run configurations.

Switch Rider configurations

Once you’ve selected the right run configuration for Wasm, we can run the Ch9 project using ASP.NET Core’s built-in server. Important note, you’ll want to open http://localhost:5000 as the calls to the Ch9 API will fail otherwise.

CH9 running under WASM

Before running the Android project, you need to ensure you have the Android SDK properly installed. You can check this by heading to Settings > Environment.

Android environment setup from Rider

The Ch9 solution is one that Uno ships actively to all app stores. To comply with security measures of each app store, we sign our final results for submission.

In the case of this demo, you need to disable this signing to run the Android project on your machine.

Navigate to the .csproj file by using the Edit Ch9.Droid.csproj context menu on the Ch9.Droid project. Right-click the project and select Edit | Edit ‘Ch9.Droid.csproj’. You can also drag the project from the Solution Explorer window into your editor.

Find and comment out the following MSBuild target to disable Android package signing.

<Target Name="GenerateBuild"
DependsOnTargets="SignAndroidPackage"
AfterTargets="Build"
Condition="'$(BuildingInsideVisualStudio)'==''" />

Again, you’ll need to set the startup project to Ch9.Android and Debug | Any CPU, or use the Ctrl+Alt+Shift+R shortcut.

Rider showing Android run configuration

If you don’t happen to have an Android device set up already, you can use the Android Virtual Device Manager (AVD) to create a new virtual android device.

android virtual device manager

Running the Ch9.Droid project should launch an Android device and deploy the app for testing.

CH9 running in Android Emulator

Finally, let’s run the same application on an iOS device. Make sure you are connected to a Mac, or are running the solution on a macOS device.

We need to switch the run configuration again and set the startup project to Ch9.iOS and Debug | iPhone Simulator. Select your iOS device or iOS simulator and hit “Run”!

Rider showing iOS simulators

For folks having issues seeing any iOS devices on macOS, ensure you have installed XCode.

running CH9 in iOS Simulator

Let’s make some changes

Now that we have seen how the app runs on our 3 different platforms, let’s make a small change to add our own personal touch.

Our main code is split between two projects, the Shared project and the UWP project. Our Shared project has our ViewModels, Assets, and Converters. Our UWP project has our Views and Styles.

All projects automatically reference the Shared project, however, for the Views in the UWP project to be shared, a linked folder has been added to each project.

Navigate to Ch9.UWP > Views > Content > ShowsPage.xaml.

Like all MVVM apps, our Views are what the user sees. This xaml file is the list of shows displayed in the screenshots above. Let’s head to the Shows grid view portion of the xaml file. The GridView should contain a custom Card element:

<material:Card HeaderContent="{Binding Show.Name}"
           HeaderContentTemplate="{StaticResource HeaderTemplate}"
           MediaContent="{Binding Show.ThumbnailUrl}"
           ios:Width="400"
           ios:Height="260"
           Background="{StaticResource MaterialSurfaceBrush}"
           MediaContentTemplate="{StaticResource SampleImageTemplate}"
           Style="{StaticResource CustomMaterialCard}" />

Change the HeaderContent to read HeaderContent="This is a Rider card!". This will update every card’s title to that text. We can now run again on our 3 platforms to see the change.

changes to xaml reflected in app

Uno Platform developers will benefit from the quick fixes and suggestions offered by Rider.

suggestion of redundant qualifier

Additionally, navigating to XAML views and their respective C# implementation classes has never been easier when developers use the “search everywhere” tool.

Search everywhere finding HtmlMediaPlayer

Speaking of XAML, developers can navigate to references, even when they have potentially multiple locations.

Now you are all set up to continue tinkering with the Ch9 project or to create your own Uno Platform app using Rider! For further reading on Uno Platform head over to www.platform.uno for more sample apps, showcases and more.


We’d like to thank Uno for their guest post, and like mentioned above, please consider Uno Platform when building cross-platform experiences.

An important note, we are considering supporting more Uno Platform XAML syntax. We want to hear your thoughts on supporting more Uno Platform features. Please vote and leave comments in this issue.

.NET Microservices == MEGAFUN – Webinar recording

$
0
0

The recording of our webinar, .NET Microservices == MEGAFUN, with LaBrina Loving, is now available. Subscribe to our community newsletter to receive notifications about future webinars.


In this session, I will provide an overview of getting started with building and deploying Microservices. We’ll explore using services like Dapr and Project Tye to help build your microservices and look at how to deploy to Azure.


(more…)

Webinar – Tips & Tricks to improve your .NET Build Setup with MSBuild

$
0
0

Join us Thursday, December 10, 2020, 16:00 – 17:00 CET (10:00 AM – 11:00 AM EST or check other timezones) for our free live webinar, Tips & Tricks to improve your .NET Build Setup with MSBuild, with Martin Ullrich.

Register now and get a reminder, or join on YouTube

MSBuild is the powerful – now open source – build system used in all .NET Builds. It has a language of its own and allows you to customize most parts of your build.
For growing code bases the requirements to the build and deployment setup of your project(s) increase as well, so in this session I want to show you a few Tips & Tricks to make working with .NET projects easier, faster and more maintainable.

After a quick crash course on its language I will show you how to use MSBuild to turn some knobs in the build process, some of which may not be available in your IDE’s UI, and go over common customizations and setups. We will also have a look at how to diagnose issues and what tools to go to when builds go wrong.
(more…)

Viewing all 306 articles
Browse latest View live