Quantcast
Channel: dotMemory : .NET Tools | The JetBrains Blog
Viewing all 307 articles
Browse latest View live

Xamarin, the best way to make NFC Apps – Webinar recording

$
0
0

The recording of our webinar, Xamarin, the best way to make NFC Apps, with Saamer Mansoor, is now available. Subscribe to our community newsletter to receive notifications about future webinars.


Learn about NFC technology, potential invention ideas, the NFC capabilities & differences between iPhone & Android apps, and why Xamarin is the best way to make cross-platform NFC Apps. Also, learn about ways to implement security and limitations.


(more…)


Webinar – OOPs, I did it again

$
0
0

Join us Thursday, February 11, 2021, 16:00 – 17:00 CET (10:00 AM – 11:00 AM EST or check other timezones) for our free live webinar, OOPs, I did it again, with João Antunes.

Register now and get a reminder, or join on YouTube

Object oriented programming is one of the most broadly used programming paradigms. The problem, however, is that most of the time, even if we use a primarily object oriented programming language, we forget to take advantage of everything it can do, resulting in a mostly procedural scenario.

In this session, João Antunes will share some ideas about how to improve our code by making it easier to understand and maintain, by taking better advantage of our languages’ capabilities, and by mixing paradigms as appropriate.

None of these ideas are new, but it seems we keep forgetting about them.

(more…)

Rider 2021.1 Roadmap

$
0
0

In this post, we’d like to share our plans for Rider 2021.1 and find out what we can do next to improve your development experience. Your feedback is always welcome!
The following is a list of our priorities for the next release cycle of 2021.1. Note that these are features we’re working on – as opposed to features scheduled for delivery – and that some of these might be delayed until a later version.

  • Code With Me: Last year collaborative coding (Code With Me) was added to our other IDEs. Since Rider has a very special architecture with a JVM frontend and a .NET backend, it requires additional steps to be properly integrated. We hope to bring CWM to the Rider 2021.1 release.
  • Welcome Screen: We’ll continue to improve our Welcome Screen to help with another common workflow, which is to debug running processes. This will allow you to open Rider and attach to a process without having to create or open a solution or project.
  • Performance: Some users might be familiar waiting a while for the solution explorer to show the structure of a solution… We are working to make the explorer load instantly without disrupting developers’ workflows, and to allow them to immediately browse their code. As always, we will look out for any opportunity to improve the performance.
  • Problems View: As developers we deal with a lot of different issues every day. In order to help our users keep track of them, we will adopt the Problems View from IntelliJ IDEA to have a single view for all problems such as missing environment components, NuGet package errors, and code inspection issues for the current file and the whole solution (solution-wide analysis).
  • ML Code Completion: As an improvement to our standard ranking in code completion, machine learning-based ranking can use data gathered anonymously during EAPs to provide results with better context relevance. Other languages are already supported in our IntelliJ IDE family, and we’re planning to use that same engine for C# ML completion in Rider as well.
  • Debugger: We are planning to introduce a quick toggle for breaking on unhandled exceptions (exception breakpoints) and stepping into external source code – a task that usually involves navigating through dialogs.
  • Localization: A new localization infrastructure to support additional languages inside Rider and all other IntellIJ-based IDEs. It’s unlikely to appear in the next release, but we’re starting our efforts on this.
  • ASP.NET Scaffolding: Adding new functionality to our web projects involves a lot of different entities with a lot of boilerplate code at the beginning. The aspnet-codegenerator is a very useful tool to scaffold controllers, identities, views, and others. We’re going to integrate the generator in our Add Item infrastructure and add a UI for easy configuration with all the necessary options for code generation.
  • WPF Preview: Reworked UI/UX with support for custom markups, design time attributes, templates, third-party controls, and resources from separate files and referenced assemblies. This also includes navigation to the corresponding tag when clicking elements in the preview and selection when elements are moved.
  • WinForms: We’ll be focusing on the toolbox to make it feel more like Rider’s other UIs. That means it will provide better filtering and grouping. We are also going to address some issues related to DevExpress components.
  • F# Support: More refactorings and quick-fixes, most notably an inline var refactoring and additional cases for the import quick-fix. We are also planning to move type providers out of process so that their runtime matches the one used during the build process.

We hope there is something interesting for you, too. Feel free to comment below, submit a new feature request in our issue tracker if we’ve missed something, or upvote any existing requests to let us know they are important to you. We’re looking forward to your feedback!

Answering Your Questions: AMA with the .NET Team on Reddit

$
0
0

Last week, we held our first Ask Me Anything (AMA) session on Reddit. We’d like to thank everyone who participated, and we hope you found it useful!

What did you think of it? Would you like us to do another AMA session in the future? Please let us know in the comments!

If you missed the session, here’s an overview of the most popular and interesting questions. For your convenience, we broke them down into three categories: ReSharper, Rider, and our .NET team.

Questions about ReSharper

How about releasing ReSharper for Visual Studio for Mac?

There are no plans to release ReSharper to Visual Studio for Mac. We believe in Rider as our .NET IDE that provides the same experience cross-platform and includes all the polished features from ReSharper, IntelliJ IDEA (support for VCS, Docker, run configurations, local history, and much more), DataGrip (DB management), and WebStorm (frontend). For getting an idea how that looks like, we’re recommending the Rider section in our .NET Guide.

Any plans to ever support VS Code in ReSharper? Or bring VS Code extensions into Rider?

No, we don’t have such plans. VS Code uses the Language Server Protocol (LSP), which provides a universal way to support pretty much any language. The downside is it also limits the features that can be implemented. Some background on this topic can be found in our article entitled “Building a .NET IDE with JetBrains Rider”, in the "The Need for a Custom Protocol" section.

As for Rider, this would require us to build and maintain an interoperability layer on top of the model our IDEs use. We instead concentrate on building the IDE itself.

Does ReSharper use Roslyn? Do you plan to move to Roslyn?

We actually had an interview about using Roslyn with two of our developers back in 2014. In short, there are 2 reasons for not doing this:

  1. It would be a tremendous effort;
  2. It is architecturally incompatible with our features.

It’s also important to note that Roslyn only supports 2 languages (C# and VB.NET), whereas ReSharper and Rider are multilingual.

What about performance of Visual Studio with ReSharper?

One of the main causes for performance issues is Visual Studio (VS) being a 32-bit process that even on beefy machines can only really use 2-3 GB of memory. This process has to hold VS, Roslyn, ReSharper, and many other extensions that ship out of the box, and are all competing for memory. If you’re interested, attach a profiler and have a look at the memory traffic and garbage collection going on. Nobody is to blame here, and it’s also not easy for Microsoft to move away from 32 bit, which is unfortunate, but that’s the way it is.

Microsoft is moving some parts of .NET support out of the VS process, and we’re working on a similar solution as well, "ReSharper out of process", where the plugin that lives in VS would be a layer to communicate with another process that is the real ReSharper. This is a big refactoring, and on top of that, it is a refactoring that is happening while new .NET versions and new C# versions are being released. It’s like changing a car’s wheels while driving on a highway. We can’t yet promise a release date, but we’re hard at work to make this happen.

In each new version of ReSharper, we fix a number of performance issues as they’re our priority. We have a tracking issue that collects a lot of background posts about performance and identifies what we’re working on. Make sure to look through the linked blog posts in the issue if you want more background on this.

If you look for ideas on how to speed up your development experience, we have a workaround that works well for many solutions and helps free up memory (though your mileage may vary). Lastly, have a look at the Performance Guide for Visual Studio as well as our article about Speeding up ReSharper and Visual Studio. If you have a specific performance issue that you can reproduce, we’d appreciate it if you could collect a performance snapshot and send it over to us.

Have you considered making an introduction to ReSharper and other educational deep-dive videos?

We frequently give public talks about our products at conferences and user groups. We always try to address the full experience scale, ranging from beginners, who’ve never heard about ReSharper or Rider, to intermediate and advanced users. Our goal is to teach everyone something new! Some of these talks are publicly available on well-known video platforms. We also maintain a .NET Guide on our website and tweet tips via @resharper and @JetBrainsRider. If you’re taking part in a user group, feel free to reach out, and we can organize a (virtual) visit!

Are there any plans to incorporate ML into ReSharper at some point?

We don’t have plans to introduce any ML capabilities in ReSharper, but we are working on it in Rider (since the IntelliJ platform already supports ML completion for a variety of languages). Hopefully, something will be released in 2021.1, stay tuned!

Questions about Rider

Will there be a community edition of Rider?

Currently we don’t have plans to release a community version of Rider in the near future. At the same time, you might want to check out our free license programs for students, teachers, OSS maintainers, user groups, and many others. Also, Rider EAP (Early Access Program) should be open somewhere in February. Additionally, Nightly builds are free of charge.

Are there plans to rework Rider’s UI/UX?

We’ve actually made a lot of updates to the UI since Rider was released in August 2017. We’ve updated the default themes, removing a lot of the enterprise grey, flattening the UI, and replacing the entire icon set. In fact, the UI now supports custom themes, and many are available as plugins (learn more). Rider also has several editor color schemes, and they are available as a plugin for other IDEs, as well.

We’ve introduced a custom drawn title bar for Windows, reducing wasted vertical space. The 2020.3 release brought in a new, simpler Welcome dialog, which is discussed in a post on the IntelliJ blog, and we recently reworked the version control tool windows to make better use of vertical and horizontal layouts, including putting the diff windows as an editor tab. We even created our own font Mono for the editor.

By default, there is only one toolbar shown for a new user, along with the navigation bar. The only tool window shown by default is the Solution Explorer, and there are no more tool windows than there are in any of our other IDEs. All tool windows can be shown, hidden, and resized from the keyboard, and they can be moved around to different locations in the IDE. They can be docked, pinned, or floating, providing some support for multi-monitor setups, and we are actively working on improving this experience, including drag and drop docking support. We’ve recently introduced better support for dragging and dropping editor tabs to make tab groups.

The Rider team has devoted a lot of attention to context menus, and we’re trying to maintain a balance between size and functionality, especially in the editor and the Solution Explorer.

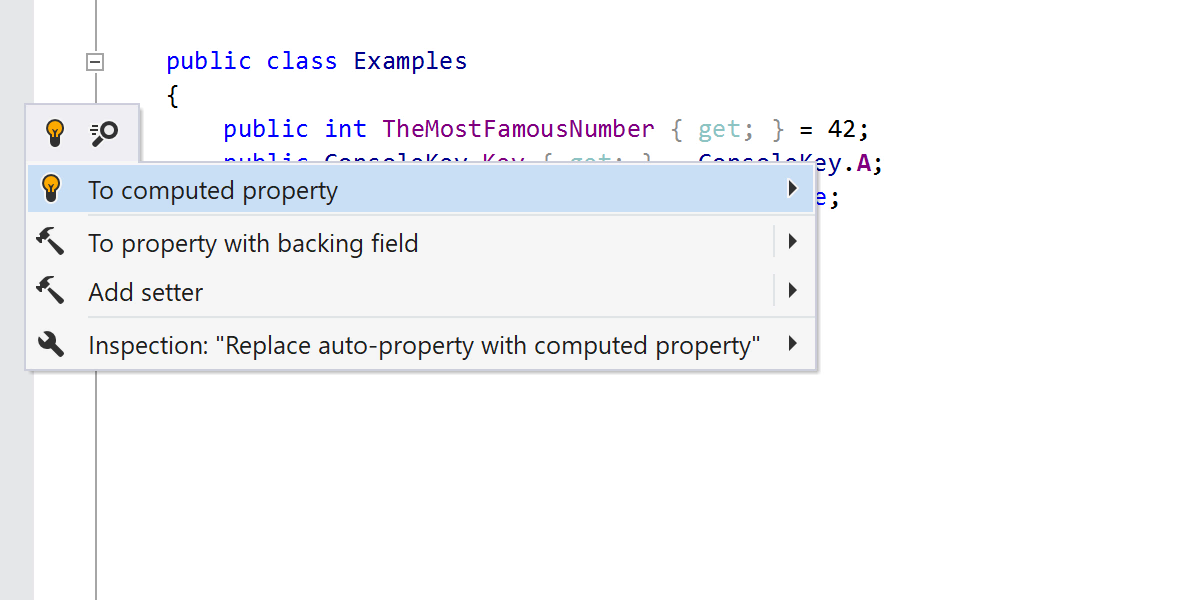
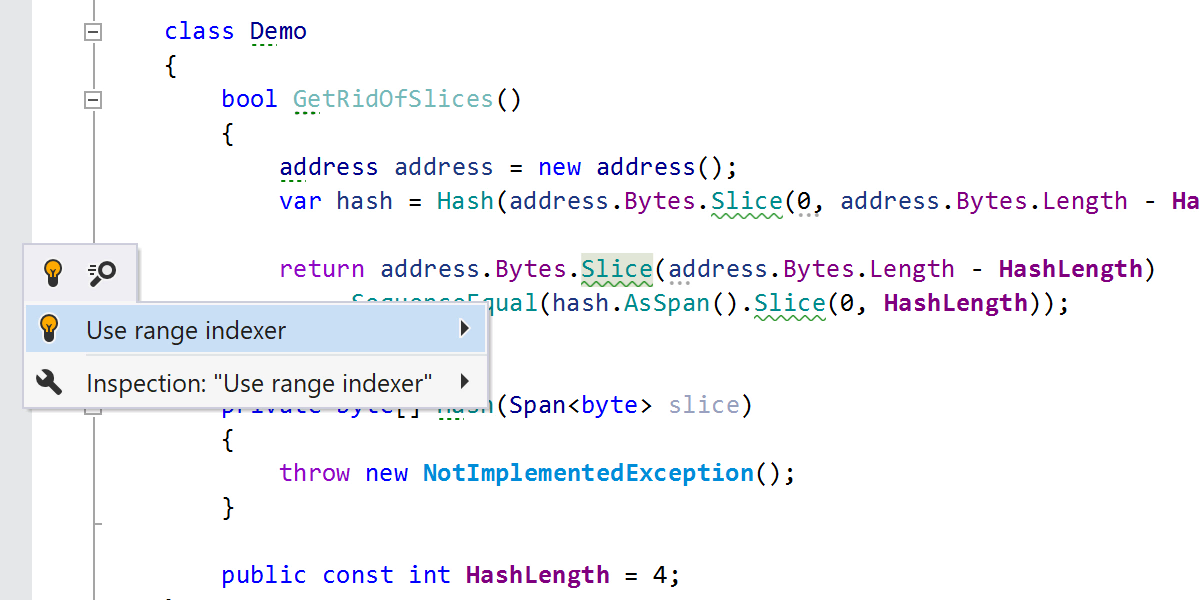
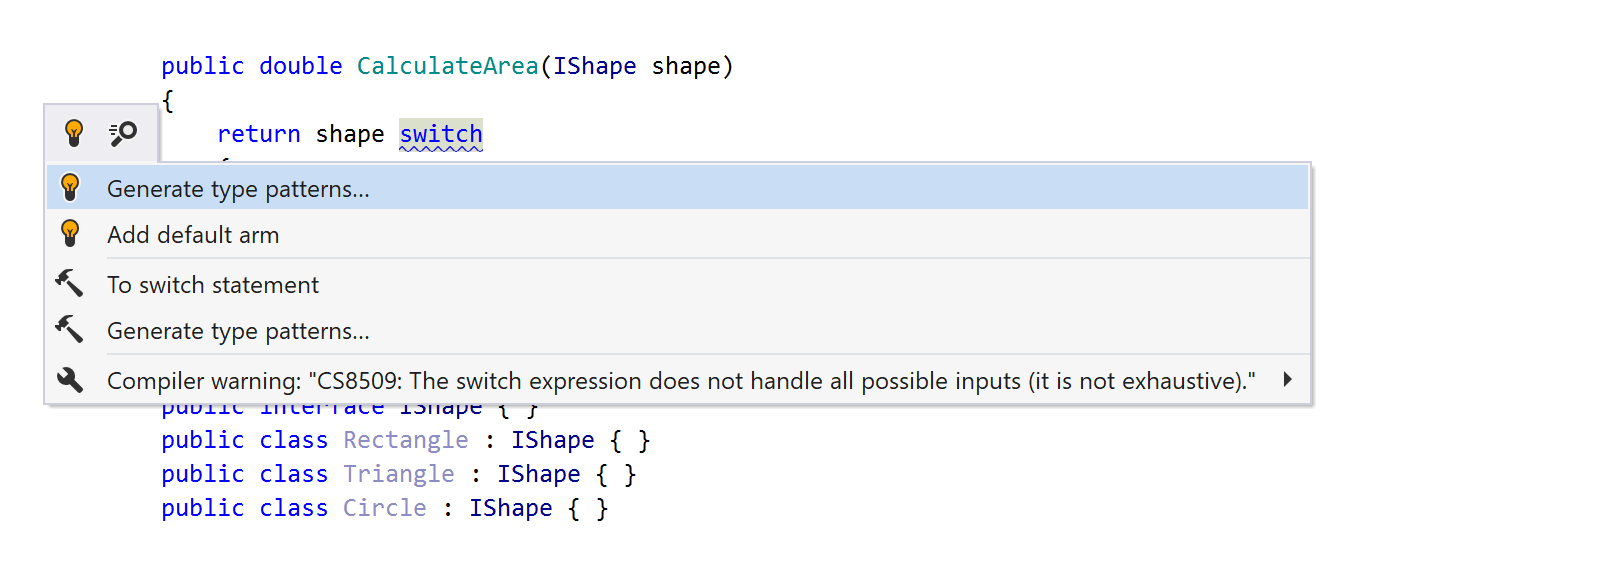
Long story short, we’re constantly looking at the UI/UX of Rider and the other IntelliJ products, and we want the IDE to both look good and also be good to use. With Rider, for example, we’ve tried to make the Alt+Enter menu the main entry point to the vast majority of Rider’s features. You can always use Alt+Enter to get to the navigation, refactoring, and generation menus, for example, or you can just start typing to search for actions.

What’s your long term (2-3 years) vision for Rider?

While it’s hard to make 3-year predictions for such a rapidly growing and changing market, we’ve identified a few directions in which we want the product to grow: general cross-platform .NET development; web development with ASP.NET and ASP.NET Core; cloud .NET development; mobile development, especially Xamarin; and of course, game development (in the broadest sense). For each of these directions, we are carefully investigating the market, the most commonly used technologies, and typical developer workflows and approaches, and we’re doing our best to support the most essential and widely used of them in the product. This helps us build our roadmap, which we are happy to share with our blog readers here.

When will we see the Windows version of Rider using the .NET Core backend?

We hope to release it this year. We already have a working prototype, but there are some technical problems that have not yet been resolved (e.g., we should support Windows-only technologies like WinForms and WPF, replace NGen with CrossGen, etc.) The optimistic estimate is Rider 2021.2, but it could still be postponed to 2021.3.

When can we expect Rider to run on Apple Silicon M1 chips?

Last year, we migrated from Mono to .NET Core on macOS and Linux, the main reasons for that being performance and stability (see our blog post on the migration). To run Rider in fully native mode on M1, we’ll have to wait until .NET Core is able to run on these CPUs (assuming the JVM part is ready for them).

Currently we’re thinking about preparing some sort of intermediate build, where the frontend process will run on M1 natively and the backend process will run on Rosetta 2 (the hypothesis being that performance of the backend process is not as critical for the perceived IDE performance as the frontend). Whether we’ll publicly release any results of this experiment fully depends on how stable it is, and how soon Rosetta 2 will be able to run .NET Core programs without significant problems (it seems that Apple is working on it; see details).

Feel free to subscribe to the tracking issue, where we’ll publish any news.

Thoughts on native WSL2 support for Rider?

Support for WSL 2 is pretty complicated. Essentially, it requires a full local development experience, but while storing the code and running some of the processes on a remote machine with its own file system and set of software (mind Git and .NET SDK, including MSBuild which we usually host on our side), as well as things like Docker.

We’re slowly moving towards it, but we don’t expect it to land in the next 2021.1 release.

When will the XAML support be added to Rider for .NET Core?

We’re currently rebuilding our XAML previewer platform to be ready for future changes. In 2021.1, we expect a significantly better XAML previewer for .NET Framework projects, and later we’re planning to release a previewer for .NET Core, too. It is a long process because of the technological challenges (it’s not easy to integrate a whole window from an external process directly into our UI), but we’re working on it right now.

Any plans for when C++ support will be landing in Rider?

We now have Rider for Unreal Engine which brings C++ and UE-specific support to Rider. The main targeting is game development, as our main C++ IDE is still and will be CLion. However, if you have an MSBuild project and want some tool to substitute VS for it, Rider will work for you and you can use it that way.

Any ETA on production-ready Rider for Unreal Engine?

We are now working hard to bring Rider for UE to macOS (most of it has been ported already) and Linux (work on this has just started). We are also trying to get access to the console’s SDKs and devkits from the vendors. This process takes a lot of time and effort, and unfortunately, it is a showstopper for console support in Rider. We need the latter to investigate the opportunities for Rider to integrate with major consoles. Another major point to be resolved before the official release is the quality of the debugger (which we implement on top of LLDB on our own). Once we are satisfied with all of this, we’ll be ready for the release. We do hope it will happen in 2021, but we can’t provide you with an estimate at this point.

What is the plan to bring dotMemory and dotTrace to Linux and macOS?

The profilers should work, either in Rider or command-line. Inspecting snapshots is another story. Cross-platform UI for that is under development.

Will dotPeek become cross-platform?

It already is, in the form of Rider. Of course, you need a project/solution open, but most of the dotPeek functionality is there.

Questions about JetBrains .NET Team

How big is the .NET team?

We currently have 131 members in our .NET department, which includes the teams from ReSharper, Rider, dotMemory, dotPeek, dotTrace, and dotCover, as well as a variety of positions in development, QA, marketing, and advocacy. Since our tools are heavily integrated, there are no clear boundaries. Communication between different teams happens quite regularly. For instance, our Rider developers work closely with the IntelliJ team, and members of our dotTools help with the integration in our IDEs.

What process are you using (SCRUM, Kanban, something else)?

Each team is responsible for its own product, including its development process. Teams may use whatever way they think works. That said, in the .NET department we usually have a planning meeting once per release. Important milestones in the development of specific tasks are often openly discussed in a dedicated meeting with the whole team where everyone can bring up their thoughts.

What languages does the codebase that the .NET team directly maintains consist of?

The majority of ReSharper and Rider’s backend code is written in C#. I’d said it is about 85% of the codebase. For the sake of dogfooding some of the code that deals with VB.NET support is written in VB.NET and C++ support is written in managed C++. Likewise the F# plugin is written in F#.

Rider’s frontend (the part that is integrated into IntelliJ Idea) is written in Kotlin. There are some pieces of native code in C++ around LevelDB (the database we use for caches) and in profilers.

The code that does process instrumentation for the profilers and dotCover is pure C++, but the viewers and data processing are written in C# and WPF. We are rewriting some of the views in Avalonia in order to have a cross-platform profiler’s UI in the future.

Are you sharing functionality with other products? If so, how much and how does work of other teams affects you?

We share a huge amount of functionality across the different IDEs based on the IntelliJ Platform, such as IntelliJ IDEA, Rider, WebStorm, GoLand, DataGrip, and so on. They’re all built on the open-source IntelliJ Platform, which provides a core framework for building an IDE – the editor, support for project systems, language parsing and indexing, inspections, Alt+Enter refactorings, debugging, and loads more.

Most features are built as plugins, and the teams responsible for specific IDEs are free to bundle the plugins they want. This is a great solution for us because we can share functionality, we can have teams that focus on specific features, or even on an entire IDE, but the feature set can be shared across all IntelliJ-based IDEs. A good example here is DataGrip. It’s a great standalone product, but it is also built as a plugin, which means Rider (and many other IDEs) can bundle it and provide first-class, integrated database tooling.

Also, we have a great IDE for web development in WebStorm, and Rider can have great web functionality, effectively for free, allowing the Rider team to focus on core Rider features, like .NET integration and so on. Speaking of Android Studio, Rider can pull in the Android functionality from the official Android IDE to support Xamarin development.

Working with other teams also tends to work just fine. JetBrains has a very flat structure, with very little bureaucracy. This means it’s very easy to talk to other teams and give feedback or request features. Things aren’t always perfect – we still get breaking changes and experience other hiccups, but we try our best to minimize these.

Rider has more difficulties than the other IDEs due to its architecture. Most IDEs based on the IntelliJ Platform build support in the same way. The project model, language parsers, inspections, the debugger, and more are all written in Java and Kotlin and run in a process in the JVM-based IntelliJ app. Rider uses the IntelliJ Platform as the frontend but uses ReSharper as the .NET language engine. So Rider has a lot of facades on the IntelliJ side that talk to ReSharper running as a headless service (you can read more about this architecture here). But this means that there is less information available on the IntelliJ side for plugins to be able to do something interesting. For example, the Rainbow Brackets plugin uses a file’s syntax tree to find matching braces and highlight them in a different color per scope. For a long time, there wasn’t a syntax tree on the IntelliJ side, so it wasn’t possible to implement this for C#. Recent versions of Rider have included a simple syntax tree, so it’s now possible to implement, but there are still some features that aren’t available because the syntax tree isn’t fully featured. It works both ways – some of Rider’s features are provided by ReSharper, and so they aren’t available in other IDEs. And of course, even similar features available in both IntelliJ and ReSharper can be very different architecturally, which means it’s very hard to bring features across. An example of this case is Structural Search and Replace, which works differently in ReSharper than it does in the IntelliJ Platform.

How do you decide what features or bugs to work on next? To what extent can a single developer decide for themselves what to look into?

This might vary a bit from team to team, but in general, developers have a lot of freedom over the tasks they want to work on. Apart from serious regressions, every developer can choose for themselves what they want to implement next and start working on fixing a bug or implementing a feature without any formal approval process. However, large features that might have performance implications are presented to the team and discussed before they make it into the product. There are also language support tasks that must be finished before the next version of the language is released, regardless of whether there’s a developer who wants to take ownership of a language feature. Such tasks are usually discussed when the feature set for the next language version is finalized and assigned to developers based on their workload and expertise in the particular area affected by the language feature.


We hope you enjoyed our AMA session! Please remember our blog and social media channels are always open to questions, so don’t hesitate to get in touch with us. If you’re experiencing issues, contact us on Twitter, file a support ticket, and use our issue tracker. We’re here to help!

ReSharper 2021.1 roadmap

$
0
0

We recently posted our roadmap for Rider 2021.1, so let’s take a look today at what’s brewing for ReSharper 2021.1, and the other dotUltimate tools. As with the Rider post, this is a list of what we’re working on, what we hope and currently intend to ship with ReSharper 2021.1. As ever, priorities can change and we might move things in and out of scope.

Let’s dive in, and please, let us know your feedback!

  • Out of process. Stop us if you’ve heard this one before. Yes, we’re still working on running ReSharper outside of the Visual Studio process, and yes, we’ve been talking about it for a very long time. But we are making steady progress on a mammoth task. We can already run a bare bones instance of ReSharper out of process, with a project model, language parsing and analysis and more (which is quite a lot for “bare bones”).

    We’ve recently been migrating all ReSharper actions so they can run in this backend process. These are the toolbar buttons, menu items and context menu items – UI elements which obviously need to integrate with Visual Studio, but now need to also work asynchronously in another process (we need to keep current ReSharper running in process, while we work on out of process). ReSharper has approximately 700 of these actions, and we’re nearly done migrating them all.

    We’re also hard at work removing all usages of our "document" abstraction from the part of ReSharper that still needs to run in the Visual Studio frontend, which will allow us to properly separate the Visual Studio editor from ReSharper running in the background process. This should see us ready for an alpha preview.

  • C# 9 and 10. The language continues to evolve, and we continue to keep up. Our C# team will be mostly focussed on C# 9, but we’re also keeping an eye on the new features currently planned for C# 10. We’ll be stabilising and improving the existing C# 9 support, including more features for pattern matching, as well as integrating existing IDE features with C# features, such as inlay hints, null analysis, top level statements, target typed ?: expressions and more.

  • Entity framework N+1 analysis. A common problem with working with object relationship mappers such as Entity Framework is that it’s very easy to hit the N+1 problem – where we get an entity with one call to the database, and then make N more database calls to get related or child entities. We’re working on bringing some inspections to ReSharper to highlight possible N+1 issues, complete with quick fixes to add the appropriate Include calls to make sure EF generates the appropriate SQL.

  • ASP.NET route insights. We’ll be pulling information about your ASP.NET routes out and providing features such as a URL/endpoint tree view and completion, navigation and find usages of URLs and routes.

  • Debugger improvements. ReSharper already provides debugging assistance with inline adornments to show values directly in the editor, rich data tips and great breakpoint management (not to mention debugging decompiled code!). In 2021.1, we’re going to be working on improving these adornments, making them work more asynchronously, and improving the performance.

    We’re still at work on predictive debugging, which we started talking about in the 2020.3 roadmap. This helps find issues before they happen, by using ReSharper’s data flow analysis to highlight the code that will be executed next. We’re hoping to ship this as a preview in 2021.1.

  • Command line tools. If you’re not already aware, it’s possible to run ReSharper’s analysis, duplication finder and code cleanup as standalone, command line tools, and as .NET Core tools!. We’ll be updating them to run on .NET 5, and we’ve added some diagnostics to generate snapshots to help with troubleshooting.

  • Testing. We’ve got several features lined up for ReSharper’s unit testing support. Firstly, we’ll bring back support for testing UWP projects, after the API was removed in Visual Studio 2019. We’ll also support discovery and tests of frameworks that use a vstest adapter and that aren’t supported "natively" by ReSharper – we handle nunit, xunit and mstest directly, as this gives us noticeably improved performance, especially in test discovery.

    We’re adding support for running JS/TS tests with Karma, and will be introducing inspections for xunit parameterised tests, and also for the popular AutoFixture package.

  • Localisation of ReSharper. This is not something that we expect to ship in 2021.1, but it’s a project that we’re kicking off this iteration. We’ve got a lot of international users of ReSharper, but we only provide English language support. We’ve recently been implementing internationalisation for our IntelliJ based IDEs, and we’re starting to do the same for ReSharper. And because ReSharper is the language engine for Rider, we want to be able to use this in Rider, too – any strings coming from the ReSharper backend need to be in the appropriate user interface language. We’re hoping to ship this later in the year.

These are our main priorities, but it’s not everything we’re working on. We’ve got some internal projects in the work with some of our interns and students (the N+1 analysis started life as an intern project), and there are more features that don’t fit under the banners above, such as support for reading custom naming rules from editorconfig, continued work with Razor and Blazor, as well as fixes and some planned optimisations for specific use cases. We’re also designing a set of metrics to capture more details about performance on a user’s machine. We’ll be talking more about this as the EAP progresses.

And of course, ReSharper is only a part of our dotUltimate family. A lot of what we’re working on in ReSharper also applies to Rider, especially C# language support and other analysis. And let’s not forget the profilers – dotTrace, dotMemory and dotCover – and our decompiler, dotPeek.

In our profilers, we’re going to extend our existing dotTrace native performance profiling to fully native applications. Currently, we can show native events and call stacks for .NET and Mono applications (great for apps that combine the two, such as Unity games), but with 2021.1, we’ll be supporting fully native apps, with no .NET stack, ideal for Unreal games. This will initially be implemented as part of the dotTrace integration in Rider (and of course, Rider for Unreal), and we’ll be bringing it to the standalone dotTrace app in a subsequent release.

The dotMemory profiler will be getting the ability to open .NET memory dumps from Linux apps. While the dotMemory application is still a Windows application, this will allow better profiling of applications built for cross platform use.

We’ll be looking at a couple of things with dotCover this release, primarily addressing some performance issues around continuous testing.

And finally, the dotPeek decompiler (both standalone and integrated with ReSharper and Rider) will get improved support for newer C# features like records and async streams and so on. We’ll also be adding formatter and code style options for decompiled code (we currently decompile to a static code style, rather than matching your existing code). And we’ll also be working on some minor UI updates.

We’re busy working on all aspects of ReSharper – features, architecture, performance and fixes. We hope you’ll find something interesting here, and since we’re very close to opening the EAP, hope you can give it a go as we work towards release. Let us know what you think, please give us your feedback, suggestions and ideas.

OSS Power-Ups: FluentValidation – Webinar recording

$
0
0

The recording of our webinar, OSS Power-Ups: FluentValidation, with Jeremy Skinner, is now available. Subscribe to our community newsletter to receive notifications about future webinars.


This is the start of our series of OSS Power-Ups, where we want to put a spotlight on open-source .NET projects. FluentValidation is a library for building strongly-typed validation rules, with amazing popularity, and over 50 million downloads on NuGet. Jeremy Skinner, the maintainer, will help us get started with some basic examples, writing custom validators, localizing error messages, and integrating the validation into ASP.NET Core.

We also have a couple of surprises for Jeremy and the users of FluentValidation to reveal. Don’t miss it, you’ll love it!


(more…)

ReSharper Tools 2021.1 Starts Early Access Program

$
0
0

Hello everyone,

Let the 2021.1 EAP begin! We’ve just published ReSharper 2021.1 EAP1, let’s see what’s inside.

ReSharper

Code Analysis

  • There’s a new inspection that checks whether an auto-property can be replaced with a computed property, along with a quick-fix to make the replacement.

  • ReSharper now suggests using the range operator instead of Slice and Substring when doing so simplifies your code.

Navigation

You now have a new navigation action – Navigate to Windows Explorer. You’ll find it in Navigate | Navigate to menu or by pressing Ctrl+Shift+A and typing its name.

![](https://blog.jetbrains.com/wp-content/uploads/2021/02/NavToWinExplorer.png)

This can be useful if you are doing something with the file itself, like copying it or copying the path inside the repository, or if you prefer to view the file’s VCS history using Git extensions for Windows Explorer.

Formatting

As usual, there are some new formatting options and improvements.

  • We continue to add support for C# 9 features, and this time we’ve added settings for a space before and within target-typed new() parentheses.
  • We’ve added settings to wrap before the assignment operator and to outdent label statements, and we’ve fixed an issue affecting indentation in multiline interpolated string inserts.

Unit Testing

  • We’ve implemented performance improvements for JavaScript and TypeScript unit testing.
  • We’ve upgraded our support for QUnit to version 2.14.0.

Other Updates

  • One more useful action we’ve added is for copying GitHub links via the ‘Copy FQN’ feature. When you invoke Copy Fully-qualified name with ReSharper | Edit or Ctrl+Shift+A, ReSharper not only does the copying, it also opens a context menu where you can choose from a variety of formats. This menu now includes GitHub links.
    ![](https://blog.jetbrains.com/wp-content/uploads/2021/02/CopyFQN.png)
  • If you frequently use RegEx, C# in Razor, or other injected languages, you’ll probably appreciate the extend / shrink selection feature, which now works in injects as well.

  • In our perpetual quest for performance, we’re working on a set of metrics that should help us analyze performance lags and gather statistics. Stay tuned, as we’ll publish the full details when they’re ready to ship.

EAP1 also includes a bunch of notable bug fixes:

  • We’ve got warnings from Windows Defender under control (RSRP-481078).
  • We’ve sped up typing in Razor files inside large solutions (RSRP-481771).
  • We’ve also sped up typing in any large files where ReSharper’s analyzers are working.

ReSharper C++

We’ve introduced support for several new C++ features from the latest standards: class types in non-type template parameters, C++20 class template argument deduction rules, and noexcept as a part of the function type. There is also a new inspection that detects template arguments that can be deduced by the language, with a quick-fix to remove redundant arguments.

We’ve also added coroutine-specific postfix templates and improved the configurability of aggregate initialization hints.

Please refer to this ReSharper C++ blog post for a detailed account of all the changes.

dotPeek

When working with several tabs at once, you can now pin them. Additionally, the color of a tab now indicates the type of code you will see – green represents a metadata view and brown stands for sources from symbol files. The options to pin tabs and to color code them can be disabled in Tools | Options | Environment | Tabs.

We’ve updated the formatter for decompiled code with a set of options to control how the code is presented. You can find them in Tools | Options | Decompiler | Code style and formatting.

That’s it for the first EAP build. We’re eager to hear how it works for you. Try it out and let us know what you think in the comments below, in our issue tracker, or on social media!

Rider 2021.1 Early Access Program Is Now Open

$
0
0

Hello everyone and welcome to the 2021 Early Access program! Here’s an update on how we’re progressing with our roadmap plans.

Debugger

Rider now has interactive debugger hints! Starting with 2020.1 EAP, hints in the editor not only show you what’s going on, but also allow you to intervene in the process. Click on the hint and invoke Set Value to enter interactive mode. You can input raw data or use other values with the help of autocompletion. Shortcuts are provided, as well.

You can enable debugger hints with the “Show values inline” setting in Settings | Build, Execution, Deployment | Debugger | Data Views.

We’ve also made a nice improvement to remote debugging on macOs: the content of processes is now shown correctly.

GameDev

There’s a whole list of improvements for Unity.

  • We’ve implemented proper Find Usages for state, state machines, and animation events in Animator. This means there’s no longer false-positive detection of unused code in these scenarios.
  • We’ve added completion of the state name for the Animator.Play method argument, as well as a check to determine whether the specified state name exists.
  • We’ve added the ability to navigate to Assembly Explorer by double-clicking an assembly in Unity Explorer.
  • We’ve added actions to show incoming and outgoing Performance Critical calls and Burst Context calls. You can invoke the actions from Code Vision, the context menu, or the gutter mark menu.
  • For Godot, we now support running tests in the game process.

Web Development

  • A long-awaited option to delete existing files in the folder before publishing is now available. It can prevent you from being stuck with obsolete data, for example, when moving files around. Beware, however, that if it’s enabled, Rider will completely clean up the target location.
  • We’ve added a new built-in browser preview that allows you to quickly preview HTML files. To open the preview, click on the icon with the Rider logo in the widget in the top-right corner of the editor.

Other Updates

  • Rider now supports building in parallel on recent versions of Mono. Enable it in Settings | Build, Execution, Deployment | Toolset and Build.
  • It is now possible to configure how Rider will treat external dependencies when searching for text. In the Find in Files dialog, select Scope and click the ‘…’ button. The Scopes window will open, and in it you can see whether External Dependencies are included or excluded from the scope. You can change their status using the buttons on the right.

That’s it for today! We would love to hear how the first EAP works for you. Feedback is appreciated here in the comments, in our issue tracker, and on social media.


.NET Annotated Monthly | February 2021

$
0
0

Happy February! Do you know this computing trivia fact? Why is the C language is named C? Because it comes after B. It almost seems too simple. But we’re not kidding!

.NET Annotated Monthly newsletter by JetBrains!

.NET news

Featured Content

Ask questions How to become a better developer by asking questionsAsking questions in a way that will bring about helpful answers is a skill. Whether that question is at popular sites like StackOverflow or when asking a teammate in person, there are some steps you can take to form an effective question to get your answers! Steve Gordon gives us all the details about asking the right questions in this excellent blog post.

ReSharper

How we quickly refactored with Resharper more than 23.000 calls to Debug.Assert() into more meaningful assertions – Patrick Smacchia’s team created the NDepend static analysis tool. Recently, they used ReSharper to refactor a massive amount of assertions! Refactoring is where ReSharper shines. It can help improve the quality of any code base, including those that are mature and large, like NDepend.

This month's featured book is Pro .NET Memory Management by Konrad Kokosa
With the help of Konrad’s book you too can understand .NET memory management internal workings and pitfalls. You can learn many techniques to address performance and scalability problems in code. Learn to write better code by knowing what’s going on under the hood. Pro .NET Memory Management is the "go to" guide to understanding and working with memory management in .NET.

Tutorials and articles

.NET tutorials

Enjoy these articles published in the past month that focus on all different types of .NET development. C#, ASP.NET, Xamarin, WinForms, Blazor and more, we got you covered!

Related programming tutorials

.NET developers almost always have to know other languages and technologies, so here are articles on technologies that .NET devs are likely to use.

Tweet tips

Awesome tip, thank you Maarten!

There’s more! Read the entire thread!

Interesting and cool stuff

Articles, tweets, and other items of interest that we’ve found.

Yes, the bugs are free! :smiley:

True story! Testers make you cry! :joy:

And finally, the latest from JetBrains

Here’s a chance to catch up on JetBrains news that you might have missed:

:memo: Take part in the Developer Ecosystem 2021 survey! :memo:

Check out this fantastic offer! CODE Magazine is offering a free subscription to JetBrains customers!

Sharing is caring! So share your content with other readers. Don’t keep it to yourself! Send a Tweet or email with tips or content for publication in future newsletters! Share with a comment here, email me at rachel.appel@jetbrains.com, or drop me a message via Twitter.

Subscribe to .NET Annotated!

Make Code More Readable by Refactoring It With ReSharper

$
0
0

Refactoring is the process of restructuring code to improve it. The improvements may be making the code more readable, formatting the code, or organizing it better.

Refactoring shouldn’t change the behavior of code, just the quality of it. Readability is an important factor in the quality of code. If you can’t read the code, you can’t maintain it well. ReSharper helps you refactor to make your code more readable and understandable.

Introduce variables for readability

Often, developers use the same expression or property over and over. When that happens the code isn’t very readable. Often, it causes the developer to have to navigate to the property declaration to recall the property’s purpose. The code is also more prone to bugs. ReSharper has the Introduce Variable intention to help you! Use Alt+Enter and convert those overused expressions to variables.

Introduce variable

DRY readability

One way to help make code more readable is adhering to the "Don’t Repeat Yourself (DRY) principle. Often, during development, code is copied or repeated a few times. This makes it more difficult to read the code, as you need to verify it is the same code and doing the same thing. It also makes introducing bugs easier, since a change in one copy of the code likely won’t be reflected in all the copies.

ReSharper has the Extract Method refactoring to help in these cases. Additionally, using the Extract Method refactoring helps keep the size of methods smaller, which in turn makes them easier to read and control defects.

In this example, we can extract the logic that calculates the fee for a bank account into its own method, and apply the fee in this one. Use Ctrl+Shift+R to refactor.

Extract method refactoring

A quick switch to readability

Code that is readable is code that humans can scan through without physically jarring their eyes, or having to pause for long to figure out simple statements.

Simple branching and switching statements should flow easily so that human eyes can easily scan them.

In the following example, an if statement makes a decision based off of an enum. This is easier to read and more efficient if we change it to the block structure format of a switch statement. A quick Alt+Enter gives us the option to switch to a switch. The code is smaller, more succinct and easier to read now. This refactoring works in reverse in case a switch statement exists and an if statement reads better.

Convert to switch statement

Short and sweet readability

Shortening a long form assignment is a tiny but useful refactoring. There’s always some code that can be shortened for readability.

A great example is the balance variable when the fee is deducted. As you can see, it’s a long hand assignment, _balance = _balance - _fee;. ReSharper notices this and displays an indicator lightbulb letting you know there’s an improvement to make with a quick Alt+Enter. Then you can you can shorten the expression to a compound assignment. This is a tiny, nice, modern refactoring.

Shorten a compound assignment

Invert for a more readable style

Sometimes, a branching structure doesn’t look right, or seems to have a difficult flow to it. Or perhaps, the agreed upon team standard is different from the block of code you’ve come across. Either way, ReSharper is there with Alt+Enter to help you refactor it to more readable and better flowing code.

Invert if statement

var readable = true ? “code is readable” : “code is not readable”

Sometimes, readability is in the eye of the beholder. This is certainly the case with if statements versus the ternary operator. Some folks prefer a style closer to English-language with if, and others prefer the compact syntax of the ?: operator.

No matter which is easier on your eyes, ReSharper has you covered. Just press Alt+Enter!

Convert if to ternary

Conclusion

ReSharper has many excellent refactorings that help you keep your code as readable and maintainable as possible. Try out refactorings not mentioned here by placing the caret on any programming construct, and pressing Alt+Enter or Ctrl+Shift+R for Refactor This.

Download ReSharper now! And let us know what you find!

OOPs, I did it again – Webinar recording

$
0
0

The recording of our webinar, OOPs, I did it again (untangling the mess we are making of object-oriented programming), with João Antunes, is now available. Subscribe to our community newsletter to receive notifications about future webinars.


Object oriented programming is one of the most broadly used programming paradigms. The problem, however, is that most of the time, even if we use a primarily object oriented programming language, we forget to take advantage of everything it can do, resulting in a mostly procedural scenario.

In this session, João Antunes will share some ideas about how to improve our code by making it easier to understand and maintain, by taking better advantage of our languages’ capabilities, and by mixing paradigms as appropriate.

None of these ideas are new, but it seems we keep forgetting about them.


(more…)

Webinar – OSS Power-Ups: Fluent Assertions

$
0
0

Join us Tuesday, March 2, 2021, 16:00 – 17:00 CET (10:00 AM – 11:00 AM EST or check other timezones) for our free live webinar, OSS Power-Ups: Fluent Assertions, with Dennis Doomen.

Register now and get a reminder, or join on YouTube

This is the second episode of our series of OSS Power-Ups, where we want to put a spotlight on open-source .NET projects. Fluent Assertions is an extensive set of extension methods that allows you to more naturally specify the expected outcome of TDD or BDD-styled unit tests. Dennis Doomen, the creator of this beautiful library, will help us getting started. Next to highlighting some of the little gems not many people may know about and how to start building your own extensions, we’ll be showing how Fluent Assertions is not just an assertion library, but a crucial ingredient for writing intention-revealing unit tests.

As always, we will have a couple of surprises for Dennis and the users of FluentAssertions to reveal. Don’t miss it!

(more…)

JetBrains .NET Day Online 2021 – Call for Speakers

$
0
0

JetBrains .NET Day Online 2021

In 2019, we held our first JetBrains .NET Day Online. After a succesful repeat in 2020, we want to again host sessions by community speakers at the JetBrains .NET Day Online 2021 on May 12, 2021.

JetBrains .NET Day Online is a free virtual event where community speakers cover topics they are passionate about, ranging from deep technical .NET content and speakers’ experiences with specific tools and technologies, to personal development.

We are looking for speakers interested in presenting with us! We welcome all topics that would be relevant to the wider .NET community.

Submit a talk!

We’ll highlight you as a speaker and any resources you may want to share, such as your blog, open source projects, online courses, etc. All accepted speakers get a 1 year Personal All Products Pack subscription on us.

TL;DR

  • Talks are in English
  • Talks are presented live
  • Talks are 60 minutes, including 5-10 minutes of Q&A (optional)
  • Talks are scheduled according to your time zone
  • Talks are recorded and published on YouTube, and are shared in our newsletters, blogs, …
  • You can show slides, do live demos, … — whatever you think works best for your content!
  • All accepted speakers get a 1 year Personal All Products Pack subscription on us
  • Please make sure you read and adhere to the Code of Conduct prior to submitting.

Frequently Asked Questions

What type of talks are you looking for?

We welcome all topics that would be relevant to the wider .NET community. We’d appreciate some link to a JetBrains product (not necessarily product focused, maybe just use it for demos).

Some areas we’re always interested in:

  • Soft skills, community, …
  • Architecture, clean code, patterns, DDD, defensive coding, …
  • F#, Fable, SAFE Stack, functional programming, …
  • Performance tuning, memory management, concurrency, benchmarking, logging, OpenTracing, …
  • Languages! C#, F#, VB.NET, source generators, …
  • ASP.NET Core, Carter, OpenAPI, gRPC, …
  • Blazor, Uno, Avalonia, Xamarin, Unity, builing a game, …
  • Databases, Entity Framework, Dapper, …
  • Testing and all of its flavours
  • Open source libraries you feel people should be aware of
  • Anything that does not fit the list above

To give you an idea, here are some talks from previous years that worked well:

  • Immutable Collections in .NET
  • Refactoring to Patterns with ReSharper
  • Building a Fantasy Game Console with C#, MonoGame, and Rider
  • Deep Dive into Async Streams
  • From C# to Python — 10 Things I Learned Along the Way
  • Formatting F# Code
  • Learning F# by Designing Your Own Language
  • TDD and The Terminator — An Introduction to Test-Driven Development
  • Developing with .NET Core on AWS Using Rider
  • Better Object Mapping in .NET with Dapper
  • Starting a Blog
  • How to Pitch Your Ideas so People Listen

Not sure if your talk idea will fit? Reach out to maarten@jetbrains.com and we can discuss!

I want to use {JetBrains tool} in my talk but I don’t have a license. Can you help?**

We have free trials available that you can download. In addition, all accepted speakers get a 1 year Personal All Products Pack subscription on us.

Do you have any other tips?

We receive many submissions and only have a limited series of slots. As such, please consider the following tips when submitting your talks, which can work in your favour.

Talk Title – We go through all talks independently of the title, but there’s no denying that a catchy and interesting title plays favourably. At the same time, make sure that the title aligns with your abstract.

Abstract – Make it concise and to the point, but don’t make it too concise. An abstract that is just 2 sentences, will most likely stand little chance of getting accepted. We don’t expect you to write an essay but please try and provide information on what you’ll be covering in your talk and what the key learning points / takeaways will be for the audience. If you’re submitting a topic that may be popular, try and find an angle that would distinguish yours from others.

Try to refrain from "don’t use this code in a real application" talks. Illustrate how something could be used in a production code base, and what the audience should know to be successful with a technology.

Level – Please try and accurately define the level of your talk.

Session Length – Sessions are 60 minutes long, including QA (which is optional)

Thanks in advance for submitting your talks!

XAML Preview Tool Improvements in Rider 2021.1 EAP

ReSharper Ultimate 2019.2 is released!

$
0
0

Hello everyone!

Please welcome the new ReSharper Ultimate 2019.2 release.

RU20192-blog@2x

ReSharper 2019.2 includes:

  • Smart support for C# 8.0 language features such as indices, ranges, and unmanaged generic structs, as well as many new quick-fixes, inspections, and context actions.

cs-blog@2x

  • The enhanced Convert concatenation to interpolation context action which can now be applied in scope.
  • A new faster “MSBuild-based” way to create a project model, which was borrowed from JetBrains Rider.
  • An updated Performance Guide page.

perfguide-blog@2x

  • Updated debugger data tips: They respect the setting “Enable property evaluation and other implicit function calls” and can evaluate property values on demand.
  • Find Usages uses the data from Solution Wide Error Analysis to gather the results. If you enable SWEA for your solution, Find Usages will show you the results significantly faster.
  • Update in Navigation: “Search in a file” through the “Go to File Member” dialog and filter out comments from the “Go To Text” results.

navigation-blog@2x

  • Improved code formatting: new formatting options for switch expressions, and you can edit EditorConfig properties right inside the Options page UI.
  • Support for the Per-Monitor DPI Awareness mode in MS Visual Studio 2019.

Learn more about the new features and download ReSharper Ultimate 2019.2.

Apart from the new features and improvements, ReSharper also has more than 300 issues fixed.

Other ReSharper Ultimate tools have received some solid updates too:

  • ReSharper C++ 2019.2 provides significantly faster indexing thanks to a new preprocessor implementation. It improves code navigation and completion actions, adds more code hints in the editor, and has new code inspections. V2019.2 also comes with more sophisticated support for the new C++20 standard, as well as better integration for Unreal Engine 4 projects.

cpp-blog@2x

  • dotCover 2019.2 supports Mono applications and unit tests on macOS, Linux, and Windows. dotCover’s console runner is now available on macOS and Linux too.
  • dotTrace 2019.2 as integrated into Rider has become more mature. It includes the full set of Timeline filters, making it easier to analyze Timeline profiling snapshots in place.
  • dotMemory 2019.2 no longer supports remote profiling. To offer you an adequate replacement, we have significantly improved the dotMemory console profiler which now supports almost all application types including .NET Core applications, IIS Express-hosted applications, and Windows services.
    It’s also worth noting that both dotTrace and dotMemory are able to attach to and profile .NET Core 3.0 Preview 7 applications.
  • dotPeek 2019.2 has a new tooltip with the description of a keyword in the IL Viewer, and a couple of updates for the metadata tree and Assembly Explorer.

Download ReSharper Ultimate


Console Profiler replaces Remote Profiling in dotMemory 2019.2

$
0
0

dotMemory 2019.2 no longer supports remote profiling. Remote profiling allowed you to profile an application running on a remote computer with dotMemory running locally. So, why did we get rid of it?

First, our statistics showed that the user base of the feature was vanishingly small. Not least because of the fact that remote profiling requires some effort from an end-user. You have to launch the remote agent on a remote machine, make sure that the agent is not blocked by a firewall, and so on. This presents certain challenges, especially in production environments.

Second, we believe that the dotMemory console profiler is a better choice for profiling on a remote computer. The process doesn’t require that much preparation and is easily reproducible (you create one batch script and use it anytime).

Before 2019.2, the console profiler could not fully replace the standalone dotMemory as it lacked support for many application types. The 2019.2 release has fixed this issue by adding separate commands for all kinds of applications:

  • get-snapshot – for attaching to a running .NET application and getting a single snapshot.
  • attach – for attaching to a running .NET application and getting any number of snapshots.
  • start – for starting a standalone .NET application under profiling.
  • start-netcore – for a .NET Core application.
  • start-iis – for (re)starting IIS under profiling.
  • start-iis-express – for an IIS Express–hosted web application.
  • start-windows-service – for (re)starting a managed Windows service under profiling.
  • start-wcf-service – for a WCF host with a specified WCF Service Library.
  • start-winrt – for a WinRT application.
  • profile-new-processes – for profiling any managed application that is launched after this command.

To use the console profiler, first, you need to download it. It’s worth noting that the tool is distributed free of charge and does not require any licenses to run.

Getting the console profiler

  1. Download a .zip file with the console profiler from our download page.
  2. Unzip the file on the remote computer.

Actually, that’s it – you’re ready to go! If you prefer NuGet, you can download the corresponding package.

Getting snapshots instantly

The most typical scenario is that some application has a memory problem and you want to instantly get a memory snapshot. For example, there’s an already running application with PID=1234 (it could be a standalone .NET / .NET Core application, IIS server, or a service).

To get a snapshot, run:
dotMemory.exe get-snapshot 1234

If you don’t know the PID but know the name (say, MyApp), run:
dotMemory.exe get-snapshot MyApp --all

Note the --all option at the end. If there’s more than one MyApp process, dotMemory will take a snapshot of each process.

Monitoring applications

Sometimes, you need to track application memory consumption over a long time interval. In this case, you can start or attach to your application under profiling and get snapshots only if a particular condition is satisfied, that is, if a periodic time interval ends, or memory consumption increases by a specified value.

For example, if you want to profile some myapp web app running on IIS server and take snapshots every 5 hours:
dotMemory.exe start-iis --trigger-timer=5h --open-url=localhost/myapp --use-browser=Chrome

Or, for example, if you want to take snapshots only when memory consumption increases by 50%:
dotMemory.exe start-iis --trigger-mem-inc=50% --open-url=localhost/myapp --use-browser=Chrome

Getting snapshots when you want

Sometimes, it’s necessary to have direct control over the profiling process; for example, you need to get a snapshot at some exact moment by a direct command. This can be done by sending special messages to stdin of dotMemory.exe.

Suppose we want to profile some IIS Express-hosted application with a configuration file. Follow these steps:

  1. Start a profiling session:
    dotMemory start-iis-express --service-output --config=.idea\config\applicationhost.config --site=MyWebApp
    Note the --service-output argument. It tells dotMemory to send service messages to stdout, like
    ##dotMemory["connected"]
  2. When you want to take a snapshot, send the following command to stdin:
    ##dotMemory["get-snapshot"]
    After the snapshot is taken, dotMemory will send the following to stdout:
    ##dotMemory["workspace-saved", {path: "..."}]

In this post, we’ve just touched on some of the console profiler’s capabilities. For more information about the tool, please refer to our online documentation or the console profiler’s built-in help:
dotMemory.exe help

To test the updated dotMemory console profiler in action, download it using this link. Note that to examine the snapshots collected by the console profiler, you should use the standalone version of dotMemory.

We’d love to hear your feedback about the console profiler!

Meet the JetBrains .NET team in Sydney, Melbourne and Brisbane

$
0
0

G’day!

This October, the JetBrains .NET team is coming to Australia, visiting Sydney, Melbourne and Brisbane. Our .NET Developer Advocates Matt Ellis and Maarten Balliauw will be visiting NDC Sydney and be part of several local events. We’ll talk about best practices when using Rider, and memory management in .NET.

Here’s where you can find us:

On Tuesday, October 15th, we are hosting a JetBrains Night in Sydney where Matt and Maarten are joined by local speaker Rob Pearson who will ship ASP.NET Core apps without Windows, using JetBrains Rider and Octopus Deploy. Register here »
While there, we will be at NDC Sydney (October 16-18) where you can find us talk about how Rider is built, and Unity for the enterprise developer. Stop by our booth for some swag and a chat! We’re happy to answer any questions you may have. Learn more »
On Monday, October 21st we’re hosting a free meetup in Melbourne, where Nicholas Blumhardt joins us and share his experience with 10 years of OSS in .NET. Register here »
Our next and final stop will be JetBrains Night Brisbane on October 22, where local speaker Nicholas Blumhardt joins us again. Register here »

Register for these events today (seats are limited). We’re looking forward to seeing you at these events down under!

ReSharper Ultimate 2019.2.3 Bugfix Is Here!

$
0
0

Moments ago we published a new bugfix – please welcome ReSharper Ultimate 2019.2.3. It delivers highly requested support for the .NET Core 3.0 release build, which was released earlier, for all the tools in the ReSharper Ultimate family!
RU2019.2-splash@2x

In addition, ReSharper 2019.2.3 includes about 30 resolved requests such as these:

  • Lots of fixes related to the MSBuild-based project model.
  • “Override” code completion does not touch members above the completed element anymore.
  • Typing a single quote in code comments does not insert a pair of single quotes anymore.

Other tools from the Ultimate pack have lots of fixes as well:

  • ReSharper C++ 2019.2.3 delivers several fixes to better support the MSBuild-based project model while loading C++ projects. The Parameter info popup now appears automatically, and focus is not lost anymore after you apply the “Generate implementation” quick-fix. The full list of fixes is here.
  • dotTrace 2019.2.3 fixes various issues.
  • dotCover 2019.2.3 fixes a number of important issues related to dotCover’s console runner.
  • dotMemory 2019.2.3 fixes issues related to unsupported types and bugs in the profiler core.

To install ReSharper Ultimate 2019.2.3, download the build from www.jetbrains.com or run ReSharper | Help | Check for Updates right in MS Visual Studio.

ReSharper Ultimate 2019.3 Starts Early Access Program!

$
0
0

Hello everyone,

October seems like a good time to launch the Early Access Program for our third release of the year, so please welcome ReSharper Ultimate 2019.3 EAP.

RU2019.3EAP-blog@2x

In the list below, I highlight several new features and improvements of the ReSharper 2019.3 EAP:

  • Improved C# 8 support including notnull constraint, the target-typed switch expressions, early support for default interface methods, a new hint "Local function can be static", and a new quick-fix "Add missing arms".

cs8@2x

  • New Type Name Hints are available for lambda’s parameters, all var occurrences including pattern matching and tuples deconstruction, range variables inside LINQ statements, and at the end of a line in a method call chain.
  • Xamarin support has a couple of important fixes such as x:DataType and Class attribute support.
  • Find dependent code now works for NuGet references and can be run for a whole solution. Also, the Find results window for Find dependent code has new filters.

find-dependent-code@2x

To see what other fixes we’ve added in the first EAP build, please see this.

For ReSharper C++, here’s what this 2019.3 EAP provides:

  • Initial support for C++20 concepts.

concepts

  • Clang-tidy integration
    • The bundled clang-tidy binary was updated to version 9 with a number of new checks. Additionally, it should no longer prevent modifications to source files.
    • Clang warnings can now be disabled from the inspection menu.
    • Added a setting to use a specific clang-tidy configuration file (instead of a setting which specified the configuration as a string)

clang-warning-disable

  • You can export your formatting options to a .clang-format file.
  • Thanks to some improvements in the code highlighting engine, re-highlighting now happens faster (after a function’s body is changed, only the body itself will be reanalyzed).
  • New quick-fixes are available to help you add a variable to the lambda capture list.
  • Unreal Engine 4 support has been improved:
    • UE smart pointers (TSharedPtr, TSharedRef, TWeakPtr, TUniquePtr) are supported similarly to std::shared_ptr/unique_ptr (e.g. they are supported by the Parameter Info, code analysis, and postfix code completion).

    makeshared

    • The new postfix template for UCLASSes expands to a proper factory function call.
    • New USTRUCT/UCLASS/UENUM/UENUMCLASS live templates are available.
    • We fixed the Visual Studio hang after executing the "Refresh Visual Studio Project" action in the Unreal Engine 4 editor.
  • Several live templates were renamed to match the corresponding keywords (e.g. “cls” to “class”, “str” to “struct”, etc.).
  • A couple of updates to the "Go to file member" dialog:
    • The dialog is now displayed instantly instead of waiting for a file to be fully analyzed.
    • If a file contains both the declaration and the definition of a function, the function is shown only once in the dialog.
  • It’s now possible to navigate to the aggregate class from the opening brace of a brace-enclosed initializer list.

navigate-aggregate

dotMemory 2019.3 EAP shows the virtual memory addresses for object instances.

The EAP for dotTrace command-line tools 2019.3 now supports profiling Mono and .NET Core applications on Linux and macOS.

dotPeek 2019.3 EAP can now navigate to the external sources of NuGet packages that have a source symbols package, such as JSON, Moq, or JetBrains.Lifetimes.

Download ReSharper EAP

ReSharper Ultimate 2019.3 Release Is Out!

$
0
0

Hello everyone,

We’ve reached the last release milestone for this year – please give a warm welcome to ReSharper Ultimate 2019.3!

RSU2019.3-blog@2x

First, let’s take a brief look at the most important changes:

  • The brand new Localization Manager helps you work more efficiently with many .resx files in your solution. It shows everything in your .resx files on a single grid, so you can observe the current state of the application or website localization and quickly find any missing resource values in any culture.

localization-manager-blog@2x

  • C# 8 support has become even better and now includes support for notnull constraints, target-typed switch expressions, early support for default interface methods, and several new inspections and quick-fixes.
  • Code generation knows more about C# 8 and helps you learn it, too.

generate-blog@2x

  • Find dependent code now works for NuGet references and can be run for the whole solution instead of just a project.

By no means are these the only updates in this release. We have even more for you:

  • C# naming settings now support reading from and exporting to EditorConfig.
  • Type Name Hints are available for all var occurrences, lambda parameters, and more.

type-name-hints-blog@2x

  • The Unit Testing tool windows have new grouping modes and new filters.
  • We’ve added more color settings for extra precision with code highlighting.
  • ReSharper Command Line Tools are available on Linux and macOS, in addition to Windows.

This is just a short list of everything that has kept our team busy over the last 4 months. Please visit What’s New in ReSharper 2019.3 to read about all the changes in more detail.


Download ReSharper Ultimate 2019.3

ReSharper C++ 2019.3

ReSharper C++ 2019.3 is here to help you adopt C++20, including support for Concepts in Find Usages, the Rename refactoring, and code inspections. New type hints in the editor can make your code easier to read, while the new formatter options help tune your code style more precisely. There are also enhancements to navigation, live templates, and Clang-Tidy integration. For game developers working on Unreal Engine 4 projects, v2019.3 delivers more templates to generate UE4-specific code, as well as support for UE4’s Smart Pointers.

cpp-blog@2x

dotTrace 2019.3

dotTrace 2019.3 gets three new features:

  • We have finally released the dotTrace command-line tool for Linux and macOS.
  • Both dotTrace in Rider and the standalone dotTrace command-line profiler now support profiling .NET Core projects on Linux and macOS. Note that only projects targeting .NET Core 3.1 are fully supported. Because of .NET Core limitations, there may be issues with profiling projects that target .NET Core 3.0 or earlier, as in some cases the application being profiled may hang or crash.
  • The call tree in the Timeline Viewer is now easier to analyze, thanks to the flame graph.

dotMemory 2019.3

dotMemory 2019.3 gets these updates:

  • A new self-profiling API, which lets applications initialize and start a profiling session on their own. The self-profiling API is distributed as a NuGet package.
  • The option to export instance details to a .json file (.bson, .hex, and .txt are also available).
  • The ability to view the virtual memory address of an object instance.

dotCover 2019.3

dotCover 2019.3 gains support for Unity projects and projects using Microsoft Fakes. In addition, dotCover is now able to group coverage results by nested namespaces in Rider, in Visual Studio, and in reports generated by the dotCover console tool.

dotPeek 2019.3

dotPeek 2019.3 can navigate to the external sources of NuGet packages that have a source symbols package (.snupkg) and supports decompiling these additional C# 7 language features:

  • Tuples
  • Deconstruction
  • Discards


Download ReSharper Ultimate 2019.3

Viewing all 307 articles
Browse latest View live