Quantcast
Channel: dotMemory : .NET Tools | The JetBrains Blog
Viewing all 306 articles
Browse latest View live

Profiling ASP.NET vNext using dotMemory and dotTrace

$
0
0

With ASP.NET vNext (working title), Microsoft is making some bold moves towards opening up development and deployment options for building applications. For starters, we no longer have to install the full .NET framework on our servers: ASP.NET vNext lets us deploy our own version of .NET on an app-by-app basis. Next, the project model is being migrated to being just a project.json file describing dependencies and some optional configuration, much like we write apps in NodeJS.

ASP.NET vNext is still in an early preview, but it never hurts to explore and test-drive what’s going to be the next generation of .NET. And when writing code for it, we may want to inspect performance and memory of our applications to verify we don’t have any issues there. And what better tools than dotMemory and dotTrace to do that?

Setting the correct CLR type

Before we start profiling, it is important to know that profiling currently only works when the Desktop CLR is active. The new Core CLR does not (yet?) expose the same profiler hooks.

Checking if the correct CLR is active can be done from the command line using the kvm list command.

Output of the kvm list command

Make sure that the active CLR (marked with an *) shows the svr50 runtime. If it’s svrc50 that means we’re on the Core CLR and have to switch to the Desktop CLR using the kvm set <pick the correct version from the above list> command.

Attaching to an already running ASP.NET vNext process

After starting dotMemory or dotTrace, hit Attach To Process on the toolbar. This will give us a list of all running processes on our local computer. Both profilers can also attach to processes running on remote machines. From this list, find the klr.exe process. When running multiple ASP.NET vNext applications on our machine, it will be a bit tricky to find the correct one.

Attach profiler

We can provide additional options and even make use of the profiler API in our ASP.NET vNext applications. Hitting Run will attach the profiler which will behave identical to profiling “classic” .NET applications. For example in dotMemory, we can see the memory usage (unmanaged and managed heaps) in real-time:

dotMemory memory usage of project K ASP.NET vNext

In dotTrace we can see the subsystems used by our code and drill down to the function or thread level.

Profiling ASP.NET vNext in dotTrace

Starting an ASP.NET vNext process with profiling enabled

When attaching to an already running process, some options will be unavailable. For example, dotMemory will be unable to collect memory traffic for an already running application. It will be impossible to pick a more detailed profiling mode for dotTrace, such as Tracing or Line-by-Line profiling. For these options to be available, we have to launch the process with profiling enabled from the start.

Running ASP.NET vNext applications is done using the k run or k web commands. These are aliases for the active runtime which is located under %USERPROFILE%\.kre\packages\<seleced runtime>\. From dotMemory and dotTrace, we can use the Profile | Standalone Application menu and enter the startup details for our ASP,NET vNext application.

Profiler configuration

Here’s what we have to specify:

  • Application: the ASP.NET vNext runtime to use. This will depend on which runtimes we have installed on or system but will look like %USERPROFILE%\.kre\packages\<seleced runtime>\bin\K.cmd.
  • Arguments: the arguments we would typically pass to the k command. If we start our application with k web, then web would be the argument to specify here.
  • Working directory is the path where our application and its project.json file are located.

Using this approach, we can now set all additional profiler options. dotMemory allows collecting memory traffic while dotTrace will let us perform Line-by-Line profiling and specify the measure used. Run will launch the application and lets us capture a snapshot we can investigate later.

Give it a try! Even with a new CLR in town we still have to care about memory and performance of our applications. Here are some resources to get started with dotMemory and dotTrace:

The post Profiling ASP.NET vNext using dotMemory and dotTrace appeared first on .NET Tools Blog.


Unusual Ways of Boosting Up App Performance. Boxing and Collections

$
0
0

This is a first post in the series. The other ones can be found here:

Many developers today are familiar with the performance profiling workflow: You run an application under the profiler, measure the execution times of methods, identify methods with high ‘own time,’ and work on optimizing them. This scenario, however, does not cover one important performance aspect: the time distributed among numerous garbage collections in your app. Of course you can evaluate the total time required for GC, but where does it come from, and how to reduce it? ‘Plain vanilla’ performance profiling won’t give you any clue about that.

Garbage collections always result from high memory traffic: the more memory is allocated, the more must be collected. As all we know, memory traffic optimization should be done with the help of a memory profiler. It allows you to determine how objects were allocated and collected and what methods stay behind these allocations. Looks simple in theory, right? However, in practice many developers end up with the words, “Okay, so some traffic in my app is generated by some system classes whose names I see for the first time in my life. I guess this could be because of some poor code design. What do I do now?”

This is what this post is about. Actually, this will be a series of posts where we share our experience of memory traffic profiling: what we consider ‘poor code design,’ how to find its traces in memory, and, of course, what we consider best practices.* Here’s a simple example: If you see objects of a value type in the heap, then surely boxing is to blame. Boxing always implies additional memory allocation, so removing is very likely to make your app better.

The first post in the series will focus on boxing. Where to look and how to act if a ‘bad memory pattern’ is detected?

*Best practices described in this series allowed us to increase the performance of certain algorithms in our .NET products by 20%-50%.

What Tools You Will Need

Before we go any further, let’s look at the tools we’ll need. The list of tools we use here at JetBrains is pretty short:

  • dotMemory memory profiler.
    The profiling algorithm is always the same regardless of the issue you’re trying to find:

    1. Start profiling your application with memory traffic collection enabled.

    2. Collect a memory snapshot after the method or functionality you’re interested in finishes working.

    3. Open the snapshot and select the Memory Traffic view.

  • ReSharper plugin called Heap Allocations Viewer. The plugin highlights all places in your code where memory is allocated. This is not a must, but it makes coding much more convenient and in some sense ‘forces’ you to avoid excessive allocations.

Boxing

Boxing is converting a value type to the object type.  For example: Boxing example

Why is this a problem? Value types are stored in the stack, while reference types (object) are stored in the managed heap. Therefore, to assign an integer value to an object, CLR has to take the value from the stack and copy it to the heap. Of course, this movement impacts app performance.

How to Find

With dotMemory, finding boxing is an elementary task:

  1. Open a memory snapshot and select the Memory Traffic view.
  2. Find objects of a value type. All these objects are the result of boxing.
  3. Identify methods that allocate these objects and generate a major portion of the traffic.

Boxing shown in dotMemory The Heap Allocations Viewer plugin also highlights allocations made because of boxing. Boxing shown by the HAV plug-in

The main concern here is that the plugin shows you only the fact of a boxing allocation. But from the performance perspective, you’re more interested in how frequently this boxing takes place. E.g., if the code with a boxing allocation is called once, then optimizing it won’t help much. Taking this into account, dotMemory is much more reliable in detecting whether boxing causes real problems.

How to Fix

First of all: before fixing the boxing issue, make sure it really is an issue, i.e. it does generate significant traffic. If it does, your task is clear-cut: rewrite your code to eliminate boxing. When you introduce some struct type, make sure that methods that work with this struct don’t convert it to a reference type anywhere in the code. For example, one common mistake is passing variables of value types to methods working with strings (e.g., String.Format):Fixing boxing

A simple fix is to call the ToString() method of the appropriate value type:Fixing boxing 2

Resizing Collections

Dynamically-sized collections such as DictionaryListHashSet, and StringBuilder have the following specifics: When the collection size exceeds the current bounds, .NET resizes the collection and redefines the entire collection in memory. Obviously, if this happens frequently, your app’s performance will suffer.

How to Find

The insides of dynamic collections can be seen in the managed heap as arrays of a value type (e.g. Int32 in case of Dictionary) or of the String type (in case of List). The best way to find resized collections is to use dotMemory. For example, to find whether Dictionary or HashSet objects in your app are resized too often:

  1. Open a memory snapshot on the Memory Traffic view.
  2. Find arrays of the System.Int32 type.
  3. Find the Dictionary<>.Resize and HashSet<>.SetCapacity methods and check the traffic they generate.

Finding resized Dictionary in dotMemoryThe workflow for the List collections is similar. The only difference is that you should check the System.String arrays and the List<>.SetCapacity method that creates them.Finding resized List in dotMemoryIn case of StringBuilder, look for System.Char arrays created by the StringBuilder.ExpandByABlock method. Finding resized StringBuilder in dotMemory

How to Fix

If the traffic caused by the ‘resize’ methods is significant, the only solution is reducing the number of cases when the resize is needed. Try to predict the required size and initialize a collection with this size or larger. Predicting collection size

In addition, keep in mind that any allocation greater than or equal to 85,000 bytes goes on the Large Object Heap (LOH). Allocating memory in LOH has some performance penalties: as LOH is not compacted, some additional interaction between CLR and the free list is required at the time of allocation. Nevertheless, in some cases allocating objects in LOH makes sense, for example, in the case of large collections that must endure the entire lifetime of an application (e.g. cache).

Enumerating Collections

When working with dynamic collections, pay attention to the way you enumerate them. The typical major headache here is enumerating a collection using foreach only knowing that it implements the IEnumerable interface. Consider the following example:Enumerating collections example

The list in the Foo method is cast to the IEnumerable interface, which implies further boxing of the enumerator.

How to Find

As with any other boxing, the described behavior can be easily seen in dotMemory.

  1. Open a memory snapshot and select the Memory Traffic view.
  2. Find the System.Collections.Generic.List+Enumerator value type and check generated traffic.
  3. Find methods that originate those objects.

Finding enumerators using dotMemory As you can see, a new enumerator was created each time we called the Foo method.

The same behavior applies to arrays as well. The only difference is that you should check traffic for the SZArrayHelper+SZGenericArrayEnumerator<> class.Finding array enumerators using dotMemory  The Heap Allocation Viewer plug-in will also warn you about hidden allocations: HAV plug-in warning about enumerator allocation

How to Fix

Avoid casting a collection to an interface. In our example above, the best solution would be to create a Foo method overload that accepts the List<string> collection.

Fixing excessive enumerator allocations

If we profile the code after the fix, we’ll see that the Foo method doesn’t create enumerators anymore.

Memory traffic after the fix

In the next installment of this series, we’re going to take a look at the best approaches for working with strings. Stay tuned!


Get dotMemory

The post Unusual Ways of Boosting Up App Performance. Boxing and Collections appeared first on .NET Tools Blog.

Unusual Ways of Boosting Up App Performance. Strings

$
0
0

This is the second post in the series. The other ones can be found here:

This post will focus on best approaches of working with strings.

Changing String Contents

String is an immutable type, meaning that the contents of a string object cannot be changed. When you change string contents, a new string object is created. This fact is the main source of performance issues caused by strings. The more you change string contents, the more memory is allocated. This, in turn, triggers garbage collections that impact app performance. A relatively simple solution is to optimize your code so as to minimize the creation of new string objects.

How to Find

Check all string instances that are not created by your code, but by the methods of the String class. The most obvious example is the String.Concat method that creates a new string each time you combine strings with the + operator.

To do this in dotMemory:

  1. In the Memory Traffic view, locate and select the System.String class.

  2. Find all methods of the String class that create the selected strings.

Consider an example of the function that reverses strings:Reversing strings example

An app that uses this function to revert a 1000-character line generates enormous memory traffic (more than 5 MB of allocated and collected memory). A memory snapshot taken with dotMemory reveals that most of the traffic (4 MB of allocations) comes from the String.Concat method, which, in turn, is called by the Reverse method.

Traffic from string objects shown in dotMemory

The Heap Allocations Viewer plug-in will also warn you about allocations by highlighting the corresponding line of code:

The HAV plug-in highlights string concatenation

How to Fix

In most cases, the fix is to use the StringBuilder class or handle a string as an array of chars using specific array methods. Considering the ‘reverse string’ example, the code could be as follows:

String concatenation code fix

dotMemory shows that traffic dropped by over 99% after the fix:

Memory traffic in dotMemory after the fix

Improving Logging

When seeking ways to optimize your project, take a look at the logging subsystem. In complex applications, for the sake of stability and support convenience, almost all actions are logged. This results in significant memory traffic from the logging subsystem. That’s why it is important to minimize allocations when writing messages to log. There are multiple ways to improve logging.*

*Actually, the optimization approaches shown in this section are universal. The logging subsystem was taken as an example because it works with strings most intensively.

Empty Arrays Allocation

A typical LogMessage method looks as follows:

logging_1


What are the pitfalls of such implementation? The main concern here is how you call this method. For example, the call

Logging call 1

will cause allocation of an empty array. In other words, this line will be equivalent to

Logging call 2

How to Find

These allocations would be difficult to detect in the memory snapshot manually, but you can use the Heap Allocations Viewer plug-in to find it very quickly:

Empty array creation shown in the HAV plug-in

How to Fix

The best solution is to create a number of method overloads with explicitly specified arguments. For instance:

Logging fix example

Hidden Boxing

The implementation above has a small drawback. What if you pass a value type to, say, the following method?

Hidden boxing example 1

For example:

Hidden boxing example 2

As the method accepts only the object argument, which is a reference type, boxing will take place.

How to Find

As with any other boxing, the main clue is a value type on the heap. So, all you need to do is look at the memory traffic and find a value type. In our case this will look as follows:

Hidden boxing shown in dotMemory

Of course, the Heap Allocations Viewer will also warn you:

Hidden boxing warning in the HAV plug-in

How to Fix

The easiest way is to use generics—a mechanism for deferring type specification until it is declared by client code. Thus, the revised version of the LogMessage method should look as follows:

Hidden boxing code fix

Early String Allocation

The advice to defer variable allocation as much as possible is quite obvious. Still, sometimes stating the obvious is useful.

Consider the code below. Here the logmsg string is created regardless of whether logging is turned on or off:

Deferring string allocation

A better solution would be:

Deferring string allocation fix

Excessive Logging

If you use logging for debugging purposes, make sure log calls never reach the release build. You can do this by using the [Conditional] attribute.

In the example below, the LogMessage method will be called only if the DEBUG attribute is explicitly defined.

Conditional attribute example

That does it for this post. In the next one, we’ll talk about the nuances of using lambda expressions and LINQ queries. To stay tuned please follow @dotMemory twitter or google+ product page!

The post Unusual Ways of Boosting Up App Performance. Strings appeared first on .NET Tools Blog.

Unusual Ways of Boosting Up App Performance. Lambdas and LINQs

$
0
0

This is the third post in the series. The previous ones can be found here:

Today, we’re going to uncover the common pitfalls of using lambda expressions and LINQ queries, and explain how you can evade them on a daily basis.

Lambda Expressions

Lambda expressions are a very powerful .NET feature that can significantly simplify your code in particular cases. Unfortunately, convenience has its price. Wrong usage of lambdas can significantly impact app performance. Let’s look at what exactly can go wrong.

The trick is in how lambdas work. To implement a lambda (which is a sort of a local function), the compiler has to create a delegate. Obviously, each time a lambda is called, a delegate is created as well. This means that if the lambda stays on a hot path (is called frequently), it will generate huge memory traffic.

Is there anything we can do? Fortunately, .NET developers have already thought about this and implemented a caching mechanism for delegates. For better understanding, consider the example below:

Caching lambdas 1

Now look at this code decompiled in dotPeek:

Caching lambdas example. Decompiled code

As you can see, a delegate is made static and created only once – LambdaTest.CS<>9__CachedAnonymousMethodDelegate1.

So, what pitfalls should we watch out for? At first glance, this behavior won’t generate any traffic. That’s true, but only as long as your lambda does not contain a closure. If you pass any context (this, an instance member, or a local variable) to a lambda, caching won’t work. It make sense: the context may change anytime, and that’s what closures are made for—passing context.

Let’s look at a more elaborate example. For example, your app uses some Substring method to get substrings from strings:

Lambdas example 1

Let’s suppose this code is called frequently and strings on input are often the same. To optimize the algorithm, you can create a cache that stores results:

Lambdas example 2

At the next step, you can optimize your algorithm so that it checks whether the substring is already in the cache:

Lambdas example 3

The Substring method now looks as follows:

Lambdas example 4

As you pass the local variable x to the lambda, the compiler is unable to cache a created delegate. Let’s look at the decompiled code:

Lambdas example. Decompiled code with no caching

There it is. A new instance of the c__DisplayClass1() is created each time the Substring method is called. The parameter x we pass to the lambda is implemented as a public field of c__DisplayClass1.

How to Find

As with any other example in this series, first of all, make sure that a certain lambda causes you performance issues, i.e. generates huge traffic. This can be easily checked in dotMemory.

  1. Open a memory snapshot and select the Memory Traffic view.
  2. Find delegates that generate significant traffic. Objects of …+c__DisplayClassN are also a hint.
  3. Identify the methods responsible for this traffic.

For instance, if the Substring method from the example above is run 10,000 times, the Memory Traffic view will look as follows:

Lambdas shown in dotMemory

As you can see, the app has allocated and collected 10,000 delegates.

When working with lambdas, the Heap Allocation Viewer also helps a lot as it can proactively detect delegate allocation. In our case, the plugin’s warning will look like this:

Warning about lambdas in the HAV plug-in

But once again, data gathered by dotMemory is more reliable, because it shows you whether this lambda is a real issue (i.e. whether it does or does not generates lots of traffic).

How to Fix

Considering how tricky lambda expressions may be, some companies even prohibit using lambdas in their development processes. We believe that lambdas are a very powerful instrument which definitely can and should be used as long as particular caution is exercised.

The main strategy when using lambdas is avoiding closures. In such a case, a created delegate will always be cached with no impact on traffic.

Thus, for our example, one solution is to not pass the parameter x to the lambda. The fix would look as follows:

Caching lambdas code fix

The updated lambda doesn’t capture any variables; therefore, its delegate should be cached. This can be confirmed by dotMemory:

Labdas caching after the fix shown in dotMemory

As you can see, now only one instance of Func is created.

If you need to pass some additional context to GetOrCreate, a similar approach (avoiding variable closure) should be used. For example:

Code example of passing additional context to lambdas

LINQ Queries

As we just saw in the previous section, lambda expressions always assume that a delegate is created. What about LINQ? The concepts of LINQ queries and lambda expressions are closely connected and have very similar implementation ‘under the hood.’ This means that all concerns we discussed for lambdas are also true for LINQs.

If your LINQ query contains a closure, the compiler won’t cache the corresponding delegate. For example:

LINQ caching example

As the threshold parameter is captured by the query, its delegate will be created each time the method is called. As with lambdas, traffic from delegates can be checked in dotMemory:

LINQ caching shown in dotMemory

Unfortunately, there’s one more pitfall to avoid when using LINQs. Any LINQ query (as any other query) assumes iteration over some data collection, which, in turn, assumes creating an iterator. The subsequent chain of reasoning should already be familiar: if this LINQ query stays on a hot path, then constant allocation of iterators will generate significant traffic.

Consider this example:

LINQ iterator allocation example

Each time GetLongNames is called, the LINQ query will create an iterator.

How to Find

With dotMemory, finding excessive iterator allocations is an easy task:

  1. Open a memory snapshot and select the Memory Traffic view.
  2. Find objects from the namespace System.Linq that contain the word “iterator”. In our example we use the Where LINQ method, so we look for System.Linq.Enumerable+WhereListIterator<string> objects.
  3. Determine the methods responsible for this traffic.

For instance, if we call the Foo method from our example 10,000 times, the Memory Traffic view will look as follows:

LINQ iterator allocation shown in dotMemory

The Heap Allocation Viewer plugin also warns us about allocations in LINQs, but only if they explicitly call LINQ methods. For example:

LINQ iterator allocation warning by the HAV plug-in

How to Fix

Unfortunately, the only answer here is to not use LINQ queries on hot paths. In most cases, a LINQ query can be replaced with foreach. In our example, a fix could look like this:

LINQ iterator allocation fix example

As no LINQs are used, no iterators will be created.

LINQ iterator allocation fix shown in dotMemory

We hope this series of posts has been helpful. Just in case, the previous two can be found here:

Please follow @dotmemory on Twitter or dotMemory google+ page to stay tuned.

The post Unusual Ways of Boosting Up App Performance. Lambdas and LINQs appeared first on .NET Tools Blog.

ReSharper 8.2.2 with JetBrains Account Support is Here

$
0
0

A new ReSharper maintenance release is now available for download. Please install this upgrade if you have experienced the following issues with ReSharper 8.2:

  • A numeric comparison error when getting or updating nuget packages (when MSBuild is used to obtain project references).
  • SSL-Certificate error while connecting to JetBrains Account.

Speaking of JetBrains Account, this is a new way of managing your licenses for JetBrains tools. As a single interaction point with JetBrains products and services, it provides a simple and convenient way to access and manage your purchases, view your order history, distribute licenses to users, and more. You can use your JetBrains Account to have single access to the following JetBrains services:

You can still use your license key to activate and work with our tools if that way is more comfortable for you.

Additional Tools

Please note that along with ReSharper 8.2.2 you can download and install compatible builds of dotTrace, dotCover and dotMemory with similar fixes for the SSL-Certificate error.

By the way, great news for dotMemory users: we’ve added two brand new automatic inspections of common WPF memory leaks types. If you are not using dotMemory yet, today’s a good day to start. Together with multiple enhancements, the minor update v4.0.10 introduces a new evaluation model: from now on you can use the trial version for 10 actual days of use, even if they are non-consecutive. Enjoy!

The post ReSharper 8.2.2 with JetBrains Account Support is Here appeared first on .NET Tools Blog.

Fighting Common WPF Memory Leaks with dotMemory

$
0
0

When developing Windows Presentation Foundation (WPF), Silverlight and Windows Store applications, a number of common memory leaks may surface. In this blog post, we’ll see how dotMemory can help detect these common WPF memory leaks and how we can fix them.

Here are the leaks we will discuss in this post:

  • Binding leak
  • Collection binding leak
  • Textbox undo leak
  • Event Handler leak
  • x:Name leak

Binding leak

WPF comes with a number of data binding patterns, which, if we break them, can cause memory leaks in our applications. Take the following class:

Person class

When we bind to an instance’s Name property, the binding target starts listening for property change notifications. If the property is not a DependencyProperty or an object that implements  INotifyPropertyChanged, WPF will resort to subscribing to the ValueChanged event of the System.ComponentModel.PropertyDescriptor class to get notifications when the source object’s property value changes.

Why is this a problem? Well, since the runtime creates a reference to this PropertyDescriptor, which in turn references our source object, and the runtime will never know when to deallocate that initial reference (unless explicitly told), both the PropertyDescriptor as well as our source object will remain in memory.

How to detect it?

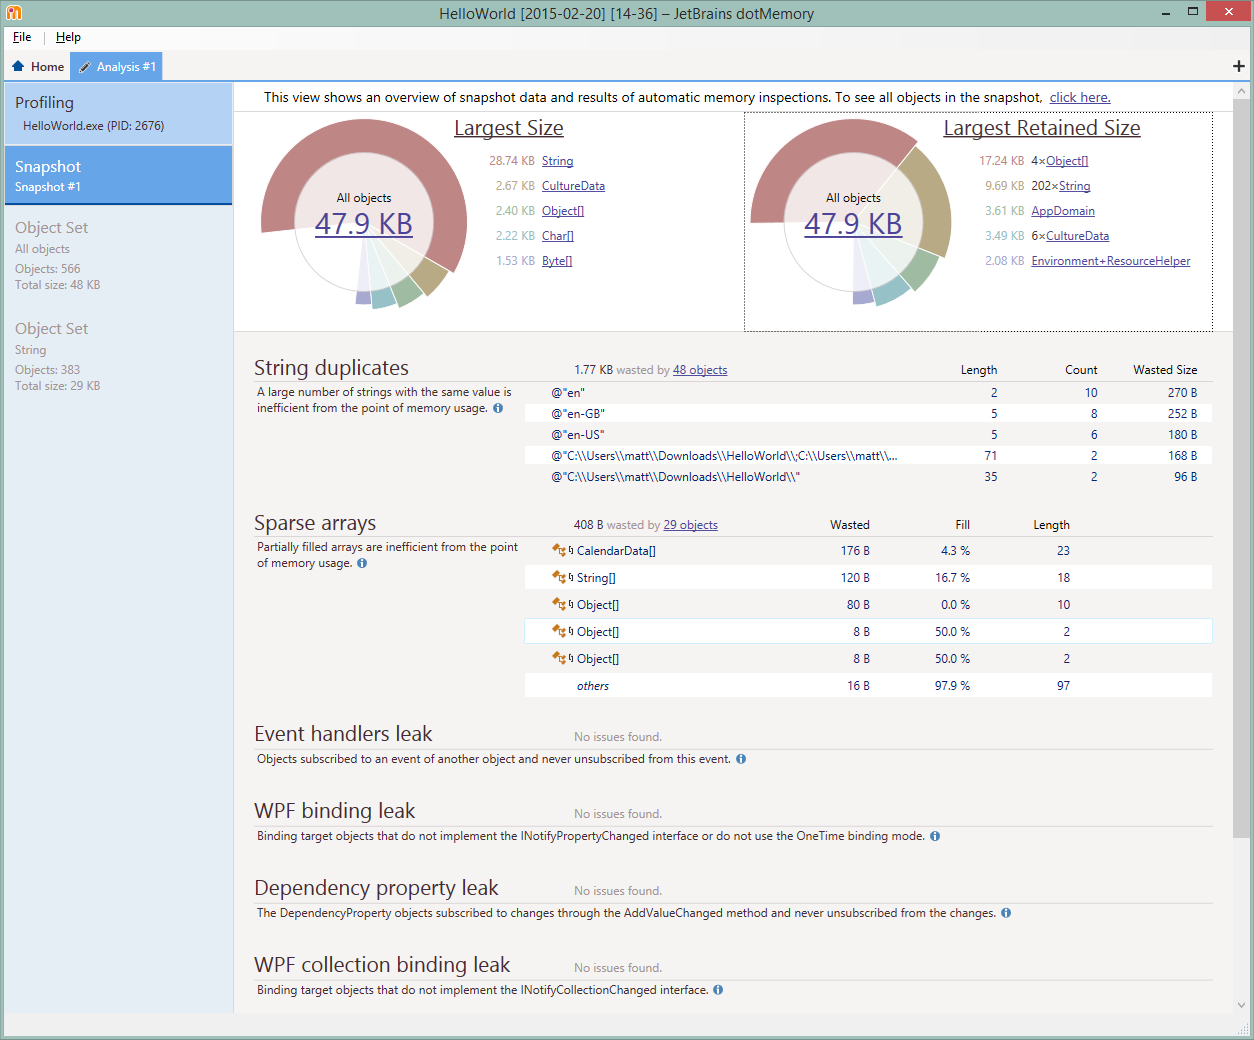
dotMemory comes with a series of automatic inspections, detecting common memory leaks. When profiling an application, we can instantiate the control which binds to our class and then dispose that control. When opening a snapshot in dotMemory, the snapshot overview page will tell us about WPF binding leaks immediately.

WPF analyze binding leak

This should be all we need to know, but let’s see if we can find proof of the theory above about the PropertyDescrriptor’s ValueChanged event handler keeping our objects in memory. After double-clicking the list entry, we can see the object set open. When we navigate to the Group by Similar Retention view, we get proof from the ValueChangedEventManager retaining our object:

Binding leak retention schema

How to fix it?

The simplest fix for a WPF binding leak would be making our Name property a DependencyProperty, or implementing the INotifyPropertyChanged interface correctly on our Person class and its Name property, like so:

Person class with INotifyPropertyChanged

If the object is of a type we can not edit, for example because it comes from a library we’re depending on, we can also explicitly clear the binding by calling:

Clear binding explicitly

Note that if a binding has the OneTime mode, this leak will not be present as the binding is done only once and the binding target will not listen for changes on the source object.

Collection binding leak

A similar issue to the WPF binding leak is the Collection binding leak. If there is binding to a collection that does not implement the INotifyCollectionChanged interface, WPF creates a strong reference to this collection. As a result, it stays in memory for the entire application lifetime.

How to detect it?

We will have to run our application and bind a control like a ListBox, for example, to our collection. Next, we can remove the binding by destroying the control and then taking a snapshot using dotMemory. We would expect our collection to be removed from memory, yet if we look at the snapshot overview we can see a WPF collection binding leak had been detected.

Detect WPF collection binding leak

If we then open the object set and look at the Group by Dominators view, we can see our collection is held in memory by the WPF DataBindEngine, an object which will be around for the lifetime of our application. And as long as our object dominator stays in memory, our collection will, too…

Analyse collection binding leak

How to fix it?

An easy way of fixing this issue is by implementing the INotifyCollectionChanged interface on our custom collection type. If the collection does not need any specific implementations, we could also inherit from the ObservableCollection type as it handles the implementation for us.

ObservableCollection

Textbox undo leak

One of the great things about WPF is that it enables Undo on several controls, like a textbox for example. For every change we make to its contents, WPF will keep the actions in memory so we can easily undo them using Ctrl+Z. Now imagine our application has a textbox in which lots of changes are being done… By default, the WPF UndoManager will keep up to 100 of these actions and in earlier WPF versions this limit was not there.

While not really a memory leak as such, having a high undo limit on textboxes in our applications may cause excessive memory usage without us evening knowing. And if we profile the application, we will see this as well.

How to detect it?

After running our application and making a large number of changes to a textbox’ contents, the dotMemory snapshot overview could show a large number of Char[] objects.

Largest Size diagram

If we drill deeper into this object set and look at the dominators (Group by Dominators), we can see that these object types are held in memory by several others. The first dominator here (TextTreeRootNode) is our textbox control itself. Of course it needs a few Char[] arrays to hold its contents. The second one however, UndoManager, is more interesting.

UndoManager

It seems the UndoManager is keeping on to quite a few Char[] arrays as well. Logical, as WPF’s undo behavior will need this information to be able to undo/redo changes made to the textbox.

How to fix it?

First of all, this is not really a leak. It’s a feature! It is important to know it’s there, though, for two reasons. The first one is when profiling WPF applications, we may see a number of Char[] arrays being created. Don’t get distracted by the UndoManager and try focusing on other dominators if the allocations are too excessive. Second, when building applications where a lot of text editing is done, high memory usage can be explained by this undo behavior.

To limit the number of entries the undo and redo stacks can hold, we can update the textbox’ UndoLimit property to a lower number. WPF used to default to –1 (unlimited) but in recent versions it defaults to 100.

UndoLimit

We could also turn off undo entirely, by changing the IsUndoEnabled property.

Turn off undo

Event Handler leak

A common leak, not only in WPF but also in other frameworks, is the event handler leak. Event handler leaks are caused by developer oversight. Here’s an example. Imagine we open an AdWindow window in our application, and let it update its contents every few seconds. We could instantiate a DispatcherTimer in our constructor and subscript to the Tick event to handle these updates.

Subscribe to Timer

Now what happens if we close this AdWindow? It all depends… If we do nothing, the DispatcherTimer will keep on firing Tick events, and since we’re still subscribed to it, the ChangeAds event handler will be called. And if that event handler has to remain in memory for it to be called, our AdWindow will stay in memory too, even if we expected it to be released.

How to detect it?

There are a number of ways to detect this type of leak. The easiest is to capture a snapshot after the object was expected to be released. In the snapshot overview page, we will immediately see if the object remained in memory because of an event handler leak.

Event Handler leak

See our AdWindow there? dotMemory detected it is kept in memory because of an event handler leak. Now how to find out which event handler is keeping it in memory… If we double-click the entry, we will see the details of the instance. Under Key Retention Paths, we can easily identify which type’s event handler retains our object in memory: the DispatcherTimer.

Key Retention Paths

If we know our code base,we know where to look. But imagine this is the first time we see the code base, how do we know where we are subscribing to this event handler?

First of all, we want to make sure our snapshot was captured collecting creation stack traces (can be enabled in the profiler options). From the Key Retention Paths diagram, we can now double-click the EventHandler entry here, which will open the specific event handler instance. From the Creation Stack Trace view, we can see we’re subscribing the event handler in the AdWindow constructor.

Creation Stack Trace

The Shortest Paths to Roots Tree view will tell us which event we’re subscribing to.

Shortest Paths to Roots

How to fix it?

From the investigation above, we know which event and which event handler we’ve forgotten to unsubscribe from (DispatcherTimer’s Tick event), and where we’re subscribing to it in the first place (the AdWindow constructor).

Unsubscribing from the event in the constructor is pointless in this case, as it would render our functionality of rotating content every few seconds useless. A more logical place to unsubscribe is when closing the AdWindow:

Closing AdWindow

Note: The DispatcherTimer example here is a special case, as the above will still not ensure our AdWindow is released from memory. If we profile the application, we’d be able to see the AdWindow instance is still there. The Key Retention Paths diagram will help discover we have to set the private variable adTimer to null as well, to remove another reference from the .NET runtime’s DispatcherTimers collection. Or how one memory leak can hide another.

x:Name leak

The beauty of building UI’s in software is that we can do some nice things with it, like removing controls from the UI when a given action is performed. Depending on how we build our UI, we may be introducing a memory leak by doing this…

WPF creates a strong global reference to the UI element that is declared in XAML if it uses the x:Name directive.

x:Name

Dynamically removing an element from code will not remove the control from memory… Not even if we remove it from the parent control’s Children collection.

Dynamically remove control

How to detect it?

After clicking he button that removes our control, we can capture a snapshot in dotMemory. The snapshot overview has an automatic inspection for x:Name leaks and will tell us our control remained in memory.

x:Name leak

We can drill down and look at the Key Retention Paths to see WPF is retaining our object in memory.

How to fix it?

To ensure the control gets removed from memory, we will have to call the UnregisterName method of the parent control. The code that removes our control from the window could be updated to look like this:

UnregisterName

There are many more common memory leaks and things we can do to improve our applications. Check the Unusual Ways of Boosting up App Performance series we did earlier.

New automatic inspections on WPF collection binding and WPF x:Name were released with the latest v.4.0.10 update on September 2, 2014. Please note: To use dotMemory 4.0.10, your subscription should be valid until September 2, 2014. Otherwise, the subscription renewal is required.

If you are not using dotMemory yet, it’s a good time to start. Together with multiple enhancements, the minor update v4.0.10 introduces a new evaluation model: from now on you can use the trial version for 10 actual days of use, even if they are non-consecutive, even if your previous evaluation period is expired. Get the latest dotMemory and enjoy!

The post Fighting Common WPF Memory Leaks with dotMemory appeared first on .NET Tools Blog.

Get dotMemory 4.1 Beta

$
0
0

It’s been a while since dotMemory 4.0 was released, and we’ve spent all this time baking a new batch of .NET memory profiling goodies for you. Please welcome dotMemory 4.1 Beta, bringing you more rigorous, convenient and beautiful profiling experience.

Here are the must-try features in dotMemory 4.1 Beta:

Disable/Enable collection allocations on the fly. To profile certain functionality of your app without slowing down all of its other areas, try disabling allocations collection directly from the real-time profiling control view. Feel free to comment on DMRY-2317 in dotMemory issue tracker.
Collection allocations
Detect more common issues in a single click. To help you focus on what really needs your attention, we’ve added a new automatic inspection: String duplicates detects the issue and shows how much memory is wasted (DMRY-2232). Two more recently added automatic inspections, both related to WPF, were announced earlier in v4.0.10.
String duplicates inspection
Copy, save and share profiling results. Simply press Ctrl+C to copy current analysis results to the clipboard. Selection and copying of multiple rows is supported for all “Type List” views, all nicely formatted and ready to be compared or shared (DMRY-454).
Formatted copy of analysis results
Get more data on GC roots. Starting from this update, dotMemory shows you the name of the field through which a static object is referenced. (DMRY-774). Later we plan to publish a good read on GC roots basics, so stay tuned.
Named static reference
Enjoy restyled UI icons. Our notion of profiling is that it should be clear, productive and even beautiful. That’s why this update features new great-looking UI icons for your viewing pleasure.
Refreshed UI icons
Name your analysis. Easily order and manage multiple memory investigations by providing your analysis tabs with custom names. Never again get lost in loads of various unnamed analyses.
Custom analysis name

dotMemory 4.1 should be out in just a couple of weeks. For now, go ahead, download dotMemory 4.1 Beta and try on all the new things shipped with this update. Feel free to share any feedback you may have:

We’re eager to hear from you, and make dotMemory 4.1 better with your help and input.

Profile with pleasure!
The dotMemory Team

The post Get dotMemory 4.1 Beta appeared first on .NET Tools Blog.

Introducing dotMemory Video Tutorials

$
0
0

Great news for .NET memory investigators, with the help from our technical evangelist Maarten Balliauw we have prepared a series of short videos that cover some of the core features of dotMemory.

dotMemory

These video tutorials should be a good starting point for users who are new to dotMemory and just starting to explore its functionality. It is focused around core features available in dotMemory, explained in short videos of 2-4 minutes each. You can learn basic concepts of .NET memory management, profiling workflow, analysis techniques and more.

32 minutes and 11 videos to watch:

Stay tuned! Subscribe to JetBrains YouTube channel and follow @dotMemory on Twitter to be notified when new videos arrived.

Maarten BalliauwMaarten Balliauw is a Technical Evangelist at JetBrains. His interests are all web: ASP.NET MVC, PHP and Windows Azure. He’s a Microsoft Most Valuable Professional (MVP) for Windows Azure and an ASPInsider. He has published many articles in both PHP and .NET literature such as MSDN magazine and PHP architect. Maarten is a frequent speaker at various national and international events such as MIX (Las Vegas), TechDays, DPC and others..

Enjoy the show!
dotMemory Team

The post Introducing dotMemory Video Tutorials appeared first on .NET Tools Blog.


dotMemory 4.1 is Released: 6+ Reasons to Upgrade

$
0
0

Today we are thrilled to introduce dotMemory 4.1 with a new batch of .NET memory profiling goodies regarding automatic inspections, profiling process control, GC roots data, and more. Please welcome dotMemory 4.1, bringing you more rigorous, convenient and beautiful profiling experience.
dotMemory 4.1 splash screen

Why upgrade to dotMemory 4.1? For at least 6 reasons:

1: Disable/Enable collection allocations on the fly.
To profile certain functionality of your app without slowing down all of its other areas, try disabling allocations collection directly from the real-time profiling control view. For your convenience allocations collection period is marked by red line on a timeline.
Collection Allocations

2: Get more data on GC roots.
Starting from this update, dotMemory shows you the name of the field through which a static object is referenced. Later we plan to publish a good read on GC roots basics, so stay tuned.
Named static reference

3: Detect more common issues in a single click.
To help you focus on what really needs your attention, we’ve added a new automatic inspection that finds String duplicates and shows the related memory waste. Two more recently added automatic inspections, both related to WPF, were announced earlier in v4.0.10.
String duplicates inspection

4: Copy, save and share profiling results.
Simply press Ctrl+C to copy current analysis results to the clipboard. Selection and copying of multiple rows is supported for all “Type List” views, all nicely formatted and ready to be compared or shared.
Formatted copy of analysis results

5: Enjoy new restyled UI icons. Our notion of profiling is that it should be clear, productive and even beautiful. That’s why this update features new great-looking UI icons for your viewing pleasure.
Refreshed UI icons

6: Name your analysis. Easily order and manage multiple memory investigations by providing your analysis tabs with custom names. Never again get lost in loads of various unnamed analyses.
Custom analysis name

+: Even more reasons?
To get the full list of enhancement and fixes, please see the release notes.

Discover all new features introduced in dotMemory 4.1 in this short Overview Demo.

Download dotMemory 4.1 and try out all the new things shipped with this update. Learn more about dotMemory 4.1 on the What’s New page. A free trial version is available for 10 actual days of use (even if they are non-consecutive). Note for existing customers: To use this update, you will need an active subscription.

Feel free to share any feedback you may have. Ask questions on the discussion forum, report bugs and feature requests to our issue tracker and/or leave comments on this blog post below. Follow @dotMemory on twitter to stay tuned about state of the art in .NET memory profiling. And to raise your skills in spotting .NET memory issues with dotMemory, watch this series of video tutorials by Maarten Balliauw, JetBrains Technical Evangelist.

Profile with pleasure!
dotMemory team

The post dotMemory 4.1 is Released: 6+ Reasons to Upgrade appeared first on .NET Tools Blog.

Introducing EAPs for dotTrace 6, dotCover 3, dotMemory 4.2

$
0
0

Please welcome a new ReSharper 9 EAP build that comes along with compatible dotTrace 6, dotCover 3 and dotMemory 4.2 Early Access builds.

Download the common .NET tools installer, launch it and choose the products you want to try.

We’ve done a great amount of work on the UI side, resulting in a more pleasant and easy-to-use profiling experience with dotTrace 6 EAP. A number of new features were also implemented, as well as the new and powerful timeline profiling option. Let’s have a look at what’s new.

dotTrace Home

When launching dotTrace 6, we’ll be presented with an all-new starting point: the dotTrace Home. From here, we can start a new local or remote profiling session for known .NET application types, attach to a running process and configure our profiling session.

dotTrace Home

Every application type will offer different settings for running the application we want to profile. Ticking the Advanced checkbox will provide us with additional options, such as using the profiler API.

If you’re new to performance profiling, check the Tutorials section on the home screen. We’ll guide you through how dotTrace works and how to analyze the data that was collected by the profiler.

Enhanced Profiling Controller

After launching a profiling session, we’ll see a new profiling controller open. We can use it to start the profiler, generate a snapshot, specify whether the profiler should continue capturing data or not, detach the profiler, or kill the running process.

Controller

With dotTrace 6 you can expand the profiling controller, providing you insight into the realtime CPU and memory usage of your application.

Profiler controller showing realtime CPU and memory usage

When our application runs multiple processes, we can select to profile any of them from the Processes page. Note that the Profile child processes option must be enabled for this to take effect.

Timeline Profiling

We’re introducing a new profiling type with dotTrace 6: Timeline profiling.

Timeline profiling collects temporal data about thread states, application events and other multi-threading data using Event Tracing for Windows (ETW). It comes in handy when analyzing multithreaded applications and lets us determine the cause of UI freezes, excessive garbage collections, uneven workload distribution, insufficient I/O and so on. The main advantage of Timeline profiling is that it not only allows us to see which calls were made by our application, but also how these calls were distributed over time.

Analyzing timeline profiling snapshots is similar to analyzing other profiling type results, with one difference: everything is bound to the timeline. We can view all events, or zoom in on a particular timespan of our application’s runtime and analyze the call tree, threads, memory allocation, garbage collection and I/O events.

Timeline profiling for multithreaded applications

In general, we can use timeline profiling all the time: just like the other profiling types it collects call stack data and allows us to determine performance bottlenecks. It is unable to determine the exact number of performed calls, making it less suitable to analyze algorithms, but that’s where tracing and line-by-line profiling are the tools of the trade.

Dissolved and Hidden Subsystems

When analyzing profiling results, we get a broad overview of subsystems used by our application. This gives us a hunch of where most time is spent: in the UI, in user code, with Garbage Collection, with I/O and so on. We can even define our own subsystems.

dotTrace subsystems view

From the options, dotTrace now lets us dissolve or hide subsystems. By default, each subsystem is visible as an entry in the subsystems pane. Making a subsystem dissolve will account the call times to its caller. Hidden subsystems will not be counted in results.

Subsystems now dissolvable or hidden

Setting these options for existing or new subsystems lets us slice and dice the profiling results in such a way that we only see the data we’re interested in.

Various UI Improvements in dotTrace 6 and dotCover 3

dotTrace 6 is now sharing a unified UI framework with ReSharper, dotCover and dotPeek. This brings an experience consistent to Visual Studio to the latest version of our profiler. All tabs and panes can be docked wherever we want, or detached from the main window so they float around. Very useful in multi-monitor setups! dotCover 3 receives a new UI for configuration settings dialog box.

Code Coverage in dotCover 3 on a Remote Machine

Code analysis in dotCover 3 can be performed on a remote machine. Set up a server and run it as a console application or Windows service on a remote machine. To perform code coverage, one needs to navigate to C:\Users\username\AppData\Local\JetBrains\Installations\dotCover01. Then, launch dotCover.RemoteCoverageServer.exe and connect to the server from the menu ReSharper -> Options -> dotCover -> Remote Coverage. In this scenario all the coverage tests are running on a remote server. This can save you a vast of performance resources on your local machine.

The Customary Trial Pitch

Give the latest versions of dotTrace 6 EAP, dotCover 3 EAP and dotMemory 4.2 EAP a try! Download the common .NET tools installer and choose products to install. Please note that doing so will remove all previous installations of ReSharper and other JetBrains .NET tools from Visual Studio, plus VS2005 and VS2008 are not supported so far.

All feedback, comments, issues and suggestions are welcome in dotTrace, dotCover and dotMemory issue trackers or through the comments below.

The post Introducing EAPs for dotTrace 6, dotCover 3, dotMemory 4.2 appeared first on .NET Tools Blog.

Meet ReSharper, ReSharper C++ and ReSharper Ultimate

$
0
0

We’d like to give a preview of updates to JetBrains .NET product line that will become effective as soon as ReSharper 9 and other JetBrains .NET tools are released in coming weeks.

TL;DR: ReSharper editions (C#, VB.NET and Full) are going away. Instead, the ReSharper product line will now consist of 3 items:

  • ReSharper (formerly Full Edition: C#, VB.NET, XAML and other languages traditionally supported by ReSharper; no C++ support),
  • ReSharper C++ (C++ support only)
  • ReSharper Ultimate (includes both ReSharper and ReSharper C++, as well as dotCover, dotTrace and doMemory.)

Please see details below, along with answers to some of the questions that we expect to be asked.

How exactly is the set of ReSharper products going to change?

ReSharper is currently available in 3 editions: C# Edition (includes all features except for VB.NET support), VB.NET Edition (includes all features except C# support), and Full Edition (includes everything that ReSharper has to offer.)

Starting with the release of ReSharper 9 next month, C# Edition and VB.NET Edition are going away, Full Edition becomes referred to as simply ReSharper, and two additional products become available. The diff looks as follows:

  • ReSharper C# Edition. Will no longer be available.
  • ReSharper VB.NET Edition. Will no longer be available.
  • What has been known as ReSharper Full Edition will now be referred to as simply ReSharper. This will include all ReSharper functionality available in the current Full Edition, including support for C#, VB.NET, ASP.NET, JavaScript, TypeScript, HTML, CSS, XAML and build scripts. However C++ support will not be available in this product. If you have an active ReSharper upgrade subscription to C#, VB.NET or Full Edition by the time of ReSharper 9 release, you will be able to upgrade to ReSharper 9 for free.
  • ReSharper C++. This is a new offering in the ReSharper product line and will only provide C++ support.
  • ReSharper Ultimate. This is also new. ReSharper Ultimate will provide all ReSharper functionality including C++ support, and it will also include all other commercial JetBrains .NET tools: the set that currently consists of dotCover, dotTrace, and dotMemory.

Here’s how the new products relate to each other: ReSharper and ReSharper C++ are distinct products but ReSharper Ultimate unites them and adds other .NET tools:

How ReSharper, ReSharper C++ and ReSharper Ultimate relate

Why change anything?

There are two major reasons behind introducing these changes:

  • We wanted to get the positioning of ReSharper and .NET tools in sync with reality. For instance, isolating C# and VB.NET editions don’t make much sense anymore as ReSharper now supports over 10 programming languages. However separating C++ support from everything else does make sense as C++ and .NET applications are usually developed separately.
  • We wanted to streamline concurrent usage of ReSharper with other .NET tools. Traditionally, many customers have been hesitant to use dotTrace, dotMemory and dotCover alongside the widely popular ReSharper. This has happened for various reasons, notably those related to price and compatibility. For example, profilers would sometimes be seen as costing too much without being fully applicable in a day-to-day .NET developer workflow, and integrating all these tools in Visual Studio could increase memory consumption to intolerable levels. Both of these problems are now solved: one (price) with recent pricing changes and integrating .NET tools into the single-license ReSharper Ultimate product, the other (compatibility) with a considerable effort of getting all JetBrains .NET tools to reuse a shared set of libraries and thus drastically decreasing memory consumption when more than a single tool (for example, ReSharper and dotCover) is integrated in the same version of Visual Studio and used concurrently.

What is ReSharper Ultimate?

ReSharper Ultimate is introduced as the top-level product in the ReSharper product line that combines all individual tools for .NET developers that JetBrains produces, as well as ReSharper C++. After the release of ReSharper 9, ReSharper Ultimate will include:

  • ReSharper
  • ReSharper C++
  • dotMemory
  • dotTrace
  • dotCover

A ReSharper Ultimate license makes a single developer eligible to use all 5 products on a single developer workstation. You can install them all at once, or at any time you feel you need them, and use a single license key to activate any of them.

Purchasing licenses to separate products will also be possible. For example, if you don’t need ReSharper but you need dotCover, dotMemory or dotTrace, you will still be able to purchase them separately. However if you need more than two of these tools, and also if you need any of these tools and ReSharper, then ReSharper Ultimate would be the easier and most probably the cheaper way to go.

Why would I be interested in ReSharper Ultimate?

There are several reasons why purchasing ReSharper Ultimate licenses can be beneficial:

  • Using both .NET languages and C++. If a single developer uses Visual Studio to code both in C# (or VB.NET, or TypeScript, or other languages supported by ReSharper) and in C++, they would probably want to have ReSharper help out in both worlds. Purchasing both ReSharper and ReSharper C++ for this developer is an option but ReSharper Ultimate is priced roughly the same and additionally makes the developer eligible to use dotCover, dotTrace and dotMemory.
  • Easier procurement and license key management. As opposed to maintaining several sets of licenses to individual JetBrains .NET tools that could be subject to different licensing terms and require renewal at different dates, you get a single license key per developer that you don’t have to renew any more often than once a year.
  • Uniform maintenance. Traditionally, JetBrains .NET tools have distributed using different licensing schemes, which would introduce unnecessary confusion at times for customers with licenses to more than a single tool. To make things easier, ReSharper Ultimate always includes a 1-year subscription meaning you won’t have to monitor subscription expiration dates for every tool, but instead you can upgrade them all for free during a year after purchase date. As soon as the first year of free subscription expires, you can renew all covered products for one more year, in one go.
  • Price. ReSharper Ultimate pricing is crazy appealing. For example, if you’re a company from the US and you’re considering buying commercial licenses to all JetBrains .NET tools, here’s how much you’d have to shell out to buy them separately:
    $349 (ReSharper) + $229 (ReSharper C++) + $249 (dotMemory) + $249 (dotTrace) + $199 (dotCover) = $1275. This is way overboard, right?
    In contrast, a single ReSharper Ultimate license that qualifies a single developer for all these products is worth only $599, which is over 50% off the package! You’re essentially getting 5 JetBrains .NET tools for the price of 2.

What if I want my ReSharper to support both .NET languages and C++?

If this is the case, you have two options:

  • Purchase both ReSharper and ReSharper C++. For a company based in the US, two commercial licenses would cost $349 (ReSharper) + $229 (ReSharper C++) = $578.
  • Purchase ReSharper Ultimate. For a company based in the US, a single ReSharper Ultimate license would cost $599. This is just a tad more expensive than the combo of two ReSharper licenses suggested above, plus the Ultimate license would also make you eligible to use dotMemory, dotTrace and dotCover.

ReSharper C++ release however is going to be delayed

While ReSharper 9 and updates to other .NET tools are expected to be released in early December, ReSharper C++ will not reach release quality by this time and will only be available as Beta. The ReSharper C++ team expects to deliver the final release in early 2015.

Therefore if you’re looking to purchase a license to ReSharper C++, you have the option to either hold off until the final release of ReSharper C++ (and use the free Beta before it goes live) or purchase ReSharper Ultimate that will cover ReSharper C++ as soon as the latter goes live.

You’ll be able to use the free ReSharper C++ Beta in any case, the choice goes down to spending money earlier (by purchasing ReSharper Ultimate) or later (by purchasing a ReSharper C++ license as soon as it’s available for purchase.)

Upgrades and renewals

Will I be able to upgrade my existing ReSharper Full/C#/VB.NET license to ReSharper 9?

Sure. If you have a license without free upgrade subscription or with an expired free upgrade subscription, this would be a paid upgrade.

However if you have a ReSharper C#, VB.NET or Full Edition license with a free upgrade subscription that is active by the time of ReSharper 9 release, you’ll be able to upgrade to ReSharper 9 for free.

Will I be able to upgrade my existing ReSharper Full/C#/VB.NET Edition license to ReSharper 9 Ultimate?

Yes, you can upgrade to ReSharper Ultimate from your current license at any time for an upgrade fee.

Will I be able to upgrade my existing dotTrace/dotCover/dotMemory license to ReSharper Ultimate?

No, there’s no explicit way to upgrade existing dotTrace (formerly dotTrace Performance), dotMemory (formerly dotTrace Memory) or dotCover licenses to ReSharper Ultimate as we don’t anticipate high demand on this upgrade path. If real demand proves us wrong, we’ll reconsider and find a solution.

For how long will I receive free updates for the products covered by ReSharper Ultimate license?

Every ReSharper Ultimate license includes 1-year subscription to all updates across all tools that it includes. After your subscription expires you can continue using the latest installed versions of the tools, and you will be eligible to receive free bug-fix updates as well (those that have 3 digits in version number).

Please note that there are no traditional “per major version” licenses to ReSharper Ultimate: when you buy (or upgrade to) a ReSharper Ultimate license, you always receive 1 year of free upgrades.

Questions?

The considerable changes outlined above can be hard to understand, and communicating them is not an easy task as well. If you have any questions, please ask them in comments, and we’ll try our best to clarify.

The post Meet ReSharper, ReSharper C++ and ReSharper Ultimate appeared first on .NET Tools Blog.

ReSharper 9 hits Beta along with other JetBrains .NET tools

$
0
0

Enough of early access to the family of .NET tools, it’s time for serious business!

Please welcome Beta releases of ReSharper 9.0, ReSharper C++, dotCover 3.0, dotTrace 6.0, dotMemory 4.2 and dotPeek 1.3.

As all of them are now available from a single installer, you can download ReSharper 9 Beta and choose to install only ReSharper or more of our .NET tools.

Read on for a recap of new functionality, the recommended way to submit feedback, and the list of major known issues.

Common installer for Beta builds of ReSharper 9 and other .NET tools

A recap of what’s new in these releases

  • ReSharper 9.0 Beta integrates into Visual Studio 2015 Preview, provides initial support for C#6.0, embeds a new Go To Action option into the Alt+Enter shortcut, introduces support for regular expressions, adds type dependency diagrams, brings more bulk quick-fixes and import actions. Client-side languages get a special treatment with 50+ new JavaScript and TypeScript quick-fixes, as well as 270 new code inspections.
  • ReSharper C++ Beta is, well, the first Beta release of a new product. The current state of C++ support in ReSharper is described here.
  • dotCover 3.0 Beta receives remote code coverage, a restyled coverage configuration dialog, a new coverage controller, as well as support for ReSharper 9 and Visual Studio 2015 Preview.
  • dotTrace 6.0 Beta introduces a completely new Timeline profiling mode for collecting temporal call stack and thread state data, refines the starting point of the profiling process with dotTrace Home view, adds more flexibility to subsystems, and supports Visual Studio 2015 Preview.
  • dotMemory 4.2 Beta learns to live on a shared platform with the other .NET tools, and therefore receives Visual Studio 2015 Preview support as well.
  • dotPeek 1.3 Beta borrows a set of actions introduced in ReSharper 9, and integrates its symbol server with ReSharper’s navigation to external sources, which basically allows setting break points in third-party code that you navigate to using ReSharper.

Note that all JetBrains .NET tools now operate on a shared platform, which conserves resources when several products are running at the same time in Visual Studio.

We need your feedback as soon as possible

If you have ignored prior Early Access builds expecting to preview ReSharper and friends on a later stage, this is probably the time for you to give the updates a try. As we are on a very tight release schedule this time, we ask you to check the known issues outlined below, and if your system environment is fine, download and install the Beta releases. When you have them installed, if anything is not working, please let us know about any critical issues as soon as possible.

If anything is going wrong, the easiest way to let us know is select ReSharper | Help | Report a Bug or Submit Feedback. In the Feedback Center window that opens, you’ll be able to briefly describe the problem you’re having, and send additional info our way: from environment information to a screenshot of your Visual Studio window to a settings file or a snapshot of your solution’s structure.

Reporting feedback on ReSharper and other JetBrains .NET tools  from Visual Studio

Beware of known issues

Some things are certain to go wrong. We know them, and you should know them, too. Here are major known issues of this Beta release:

  • Running any product under Windows with a non-English locale leads to a Visual Studio crash.
  • Integration with Visual Studio 2005 and 2008 is not supported. In fact, as announced recently, support for these versions of Visual Studio is discontinued permanently. We just thought it wouldn’t hurt to reiterate this.
  • The installer only runs on 64-bit operating systems.
  • The Beta releases don’t currently support Windows XP.
  • Standalone applications (dotTrace, dotMemory and dotPeek) don’t launch under Windows Vista.

Are you ready?

Are you not affected by the known issues outlined above? Congratulations! Download the Beta installer and give it a ride!

The post ReSharper 9 hits Beta along with other JetBrains .NET tools appeared first on .NET Tools Blog.

ReSharper 9 is Released along with dotTrace 6, dotCover 3, dotMemory 4.2 and dotPeek 1.3

$
0
0

Great news from the .NET tools development team here at JetBrains: ReSharper 9.0, dotCover 3.0, dotTrace 6.0, dotMemory 4.2 and dotPeek 1.3 are all released and available for download!

As all JetBrains .NET tools now use a single installer, you can download ReSharper 9 and choose to install only ReSharper or more of our .NET tools.

Resharper 9 is released

Highlights of ReSharper 9.0 RTM include:

  • Support for Visual Studio 2015 Preview while preserving compatibility with Visual Studio 2010, 2012 and 2013. Support for VS 2005 and 2008 has been discontinued, as described before.
  • Support for C# 6.0. Although the final C# 6.0 language design is not yet clear enough, ReSharper 9.0 already provides support for most of what is defined. New code suggestions help migrate your existing code to more concise C# 6.0 language constructs such as the conditional access operator (?.) and the long-awaited get-only auto-properties. You can get rid of curly braces with expression-bodied members, implement better DSLs using static support, play with exception filters and dictionary initializers. Please check this post for more details on C# 6.0 support.
  • New navigation features including Go to Action to search for a particular action using the legendary Alt+Enter shortcut and Navigate to Exposing APIs option for finding all the methods that are capable of returning a particular type.
  • Regular Expressions support with code completion for wildcards and regular expression groups, error highlighting, quick-fixes and a separate Regular Expression Validation Utility. Blog post about Regular Expressions support in ReSharper 9.0.
  • Fix in Scope improvements to remove redundant qualifiers, fix naming or remove regions in the scope of the whole solution. ReSharper 9.0 can look through the code in your solution and generate the appropriate imports for all the types including extension methods.
  • Type Dependencies Diagram that looks cute and helps finding out what code depends on a particular type, and what the type itself depends on.
  • Outstanding JavaScript and TypeScript support with 50+ new quick-fixes to cover over 270 different types of code issues, new live templates for common TypeScript entities, and new code generation options. The list of available refactorings is extended to include Introduce Field, Rename File, Copy type and a set of Move refactorings to ease code tweaking.

ReSharper C++ has not reached the release yet, the EAP goes on. Stay tuned for further updates!

Updates to other .NET tools

We’re also rolling out substantial updates across the whole family of JetBrains tools for .NET professionals:

  • dotTrace 6.0 introduces a completely new Timeline profiling mode for collecting temporal call stack and thread state data, refines the starting point of the profiling process with dotTrace Home view, adds more flexibility to subsystems, and supports Visual Studio 2015 Preview.
  • dotCover 3.0 supports remote code coverage, gets a restyled coverage configuration dialog, a new coverage controller and support for ReSharper 9 and Visual Studio 2015 Preview.
  • dotMemory 4.2 learns to live on a shared platform with the other .NET tools, and therefore receives Visual Studio 2015 Preview support as well.
  • dotPeek 1.3 borrows a set of actions introduced in ReSharper 9, and integrates its symbol server with ReSharper’s navigation to external sources, which basically allows setting break points in third-party code that you navigate to using ReSharper.

All JetBrains tools for .NET professionals now operate on a shared platform which means less consumption of resources when running them at the same time in Visual Studio.

Moreover, with the new ReSharper Ultimate license you can now use all of them at affordable price that includes 1 year of free upgrade subscription.

What’s new: Live sessions

If you’re interested to learn more about the new releases, read all blog posts about ReSharper 9 (there’s more of them to come soon), or register for our free webinars:

Whatever anyone can say, the best way to learn more about these updates to JetBrains .NET tools is to download a trial and test it in action!

The post ReSharper 9 is Released along with dotTrace 6, dotCover 3, dotMemory 4.2 and dotPeek 1.3 appeared first on .NET Tools Blog.

String Interning: Effective Memory Management with dotMemory

$
0
0

Starting with version 4.1, dotMemory offers the String duplicates inspection. The idea behind it is quite simple: it automatically checks memory for string objects with the same value. After you open a memory snapshot, you will see the list of such strings:

String duplicates inspection in dotMemory

How can this help? Well, string duplicates possibly indicate ineffective memory usage. Why create a new string if it is already in memory?

Imagine, for example, that in the background your app parses some text files with repetitive content (say, some XML logs).

Code example for log file processing

So, dotMemory finds a lot of strings with identical content. What can we do?

Inspection results for the example

The obvious answer – rewrite our app so that it allocates strings with unique content just once. Actually, there are at least two ways this can be done. The first one is to use the string interning mechanism provided by .NET.

CLR Intern Pool

.NET automatically performs string interning for all string literals. This is done by means of an intern pool – a special table that stores references to all unique strings. But why  aren’t the strings in our example interned? The thing is that only explicitly declared string literals are interned on the compile stage. The strings created at runtime are not checked for being already added to the pool. For example:

Interning example

Of course, you can circumvent this limitation by working with the intern pool directly. For this purpose, .NET offers two methods: String.Intern and String.IsInterned. If the string value passed to String.Intern is already in the pool, the method returns the reference to the string. Otherwise, the method adds the string to the pool and returns the reference to it. If you want to just check if a string is already interned, you should use the String.IsInterned method. It returns the reference to the string if its value is in the pool, or null of it isn’t.

Thus, the fix for our log parsing algorithm could look as follows:

CLR interning example

Further memory profiling will show that strings are successfully interned.

Inspection after the fix

Nevertheless, such an implementation has one rather serious disadvantage – the interned strings will stay in memory “forever” (or, to be more correct, they will persist for the lifetime of AppDomain, as the intern pool will store references to the strings even if they are no longer needed).

If, for example, our app has to parse a large number of different log files, this could be a problem. In such a case, a better solution would be to create a local analogue of the intern pool.

Local Intern Pool

The simplest (though very far from optimal) implementation might look like this:

Local pool code example

The processing algorithm will change a little bit as well:

Local pool example

In this case, pool will be removed from memory with the next garbage collection after ProcessLogFile is done working.

Thanks for reading! We hope this post was helpful. If you want to try dotMemory and the full set of its automatic inspections on your code, just download your free 5-day trial here.

The post String Interning: Effective Memory Management with dotMemory appeared first on .NET Tools Blog.

Unit Testing and Memory Profiling: Can They Be Combined?

$
0
0

Memory profilers can hardly be called an “everyday tool.” Typically, developers start thinking about profiling their product closer to its release. This approach may work fine until some last-minute issue like a leak or huge memory traffic crushes all your deadlines. The proactive approach would be to profile your app’s functionality on a daily basis, but who’s got the resources to do that? Well, we think there may be a solution.

If you employ unit testing in your development process, it is likely that you regularly run a number of tests on app logic. Now imagine that you can write some special “memory profiling” tests, e.g. a test that identifies leaks by checking memory for objects of particular type, or a test that tracks memory traffic and fails in case the traffic exceeds some threshold. This is exactly what dotMemory Unit framework allows you to do. The framework is distributed as a NuGet package and can be used to perform the following scenarios:

  • Checking memory for  objects of a certain type.

  • Checking memory traffic.

  • Getting the difference between memory snapshots.

  • Saving memory snapshots for further investigation in dotMemory (a standalone .NET memory profiler from JetBrains).

In other words, dotMemory Unit extends your unit testing framework with the functionality of a memory profiler.

IMPORTANT: dotMemory Unit is currently in the EAP (Early Access Program) stage. Please use it for evaluation purposes only!

How It Works

  • dotMemory Unit is distributed as a NuGet package installed to your test project:
    PM> Install-Package JetBrains.DotMemoryUnit -pre

  • dotMemory Unit requires ReSharper unit test runner. To run tests that use dotMemory Unit, you should have either dotCover 3.1 EAP or ReSharper 9.1 EAP05 installed on your system.

  • After you install the dotMemory Unit package, ReSharper’s menus for unit tests will include an additional item, Run Unit Tests under dotMemory Unit. In this mode, the test runner will execute dotMemory Unit calls as well as ordinary test logic. If you run a test the ‘normal’ way (without dotMemory Unit support), all dotMemory Unit calls will be ignored.

    Unit Tests Menu

  • dotMemory Unit works with all of the unit-testing frameworks supported by ReSharper’s unit test runner including MSTest and NUnit.

  • A standalone launcher for integrating with CI systems like JetBrains TeamCity is planned for future releases.

Now let’s take a look at some examples to better understand what dotMemory Unit does.

Example 1: Checking for Specific Objects

Let’s start with something simple. One of the most useful cases can be finding a leak by checking memory for objects of a specific type.

GetObjects Assertion

  1. A lambda is passed to the Check method of the static dotMemory class. This method will be called only in case you run the test using Run test under dotMemory Unit.

  2. The memory object passed to the lambda contains all memory data for the current execution point.

  3. The GetObjects method returns a set of objects that match the condition passed in another lambda. This line slices the memory by leaving only objects of the Foo type. The Assert expression asserts that there should be 0 objects of the Foo type.
    Note that dotMemory Unit does not force you to use any specific Assert syntax. Simply use the syntax of the framework your test is written for. For example, the line in the example uses NUnit syntax but could be easily updated for MSTest:
    MSTest Assertion

With dotMemory Unit you can select a set of objects by almost any condition, get the number of objects in this set and their size, and use these data in your assertions.
In the following example, we check for objects in the large object heap:

Checking for Specific Objects


Example 2: Checking Memory Traffic

The test for checking memory traffic is even simpler. All you need do to is mark the test with the AssertTraffic attribute. In the example below, we assert that the amount of memory allocated by all the code in TestMethod1 does not exceed 1,000 bytes.

AssertTraffic Attribute Example

Example 3: Complex Scenarios for Checking Memory Traffic

If you need to get more complex information about memory traffic (say, check for traffic of objects of a particular type during some specific time interval), you can use a similar approach to the one from the first example. The lambdas passed to the dotMemory.Check method slice and dice traffic data by various conditions.

Check Traffic with Traffic Type

  1. To mark time intervals where memory traffic can be analyzed, use checkpoints created by dotMemory.Check (as you probably guessed, this method simply takes a memory snapshot).

  2. The checkpoint that defines the starting point of the interval is passed to the GetTrafficFrom method.
    For example, this line asserts that the total size of objects implementing the IFoo interface created in the interval between memoryCheckPoint1 and memoryCheckPoint2 is less than 1,000 bytes.

  3. You can get traffic data for any checkpoint that was set earlier. Thus, this line gets traffic between the current dotMemory.Check call and memoryCheckPoint2.

Example 4: Comparing Snapshots

Like in the ‘standalone’ dotMemory profiler, you can use checkpoints not only to compare traffic but for all kinds of snapshot comparisons. In the example below we assert that no objects from the MyApp namespace survived garbage collection in the interval between memoryCheckPoint1 and the second dotMemory.Check call.

Compare Snapshots

Conclusion

dotMemory Unit is very flexible and allows you to check almost any aspect of app memory usage. Use “memory” tests in the same way as unit tests on app logic:

  • After you manually find an issue (such as a leak), write a memory test that covers it.

  • Write tests for proactive testing – to ensure that new product features do not create any memory issues, like objects left in memory or large traffic.

Thanks for reading and don’t hesitate to try dotMemory Unit EAP on your own! It’s absolutely free, and the only requirement is ReSharper or dotCover installed on your machine.

The post Unit Testing and Memory Profiling: Can They Be Combined? appeared first on .NET Tools Blog.


Exploring .NET Core with ReSharper Ultimate

$
0
0

We recently started the EAP for ReSharper 9.1, and it might have been easy to miss that the EAP is not just for ReSharper, but for ReSharper Ultimate – that is, our entire .NET tools product range. Starting with ReSharper 9.0, we unified the way we both build and distribute our .NET tools, so that they share a common install. This has many benefits, from licensing to sharing in-memory caches between products. So not only is it the ReSharper 9.1 EAP, but it’s the EAP for dotCover 3.1, dotTrace 6.1, dotMemory 4.3 and dotPeek 1.4.

With EAP03, we’re introducing support for .NET Core to ReSharper Ultimate. This means you can get code coverage and performance and memory profiling for your .NET Core apps.

But let’s back up. What’s .NET Core?

This is Microsoft’s new, Open Source, cross platform .NET stack. It is the next generation of .NET, designed to replace the need for Portable Class Libraries by providing a common, modular .NET implementation across all platforms, including ASP.NET vNext. (One slightly confusing part is that it doesn’t replace the .NET Framework. This will still be Microsoft’s .NET stack on the Windows desktop, and will remain in use, and supported for both compatibility reasons and to support desktop apps, such as WPF.)

It’s made up of a couple of pieces – the CoreCLR project is the runtime, containing the JIT and the Garbage Collector, and the Base Class Library is being reimplemented in the CoreFX project.

One of the nice things about a .NET Core application is that it is xcopy deployable. That is, .NET Core apps don’t require an install, or a GAC, or anything. All of the files required to run an application can live in a single folder.

Explorer showing the files in the HelloWorld sample

This test application is the HelloWorld app from the CoreFX Lab repo. As we can see, the folder contains everything we need to run the application. The BCL System assemblies are present, perhaps a few more than you’re used to on the desktop – this allows for a more modular distribution of the BCL, only distributing the assemblies you use. You can also see mscorlib.dll, which provides the primitive types, such as Object and String, and coreclr.dll, which is the actual runtime, including the JIT and the garbage collector. Most interestingly, we have three other files – HelloWorld.dll, CoreRun.exe and HelloWorld.exe.

dotPeek showing decompiled code

If we take a look at these files in dotPeek, we can see that the System assemblies and HelloWorld.dll are just normal looking assemblies, although they’re now targeting .NET Core v4.5, rather than the .NET Framework. Furthermore, we can see that HelloWorld.dll contains our Program class, with a normal static Main method – this is the entry point to the application. And coreclr is listed as “not supported”, as we know that’s a dll containing the native code for the runtime itself.

So what are HelloWorld.exe and CoreRun.exe?

These files are also coming up as “not supported” in dotPeek, and if we look at the their file sizes, we see that they’re both very small, only about 40Kb each. These files are native stubs, and are used to bootstrap the .NET Core runtime and launch the .NET application. The stub will load coreclr.dll, initialize the runtime and point it to the managed code to run.

The CoreRun.exe process is a generic launcher that requires the HelloWorld.dll to be passed in as a command line parameter, and provides extra command line parsing to enable attaching a debugger, and providing verbose output. The HelloWorld.exe process is simpler, and requires no command line parameters, automatically launching HelloWorld.dll and passing any command line parameters to the .NET application.

These stubs are required for .NET Core primarily to allow for running cross platform. Traditional .NET Framework applications combine the bootstrap stub and the .NET application code and metadata (HelloWorld.dll) so the .NET application just works transparently (in fact, versions of Windows later than Windows XP recognize .NET applications at the Operating System level, and bootstrap the .NET Framework automatically). But if we want to run the HelloWorld .NET application on OS X or Linux, then we can’t just run HelloWorld.exe – other operating systems don’t know how to launch .exe files, and might not even be Intel-based! So on other operating systems, the stub can be replaced with another executable, without having to replace the .NET application.

Image of HelloWorld console application running

We can dive deeper into .NET Core applications, by profiling and analyzing them at runtime.

We can use dotCover to provide code coverage – note that DrawWindows is being called, but not DrawLinux or DrawMac. (While .NET Core is cross-platform, ReSharper Ultimate is a set of .NET Framework applications, using WPF, and as such, tied to Windows.)

dotCover showing coverage for the HelloWorld application

Performance profiling is handled by dotTrace, which can provide a nice timeline view of the performance of a .NET Core application, with powerful filtering capabilities to filter based on CPU, CPU state, thread and so on. Hopefully you’ll be working on slightly more interesting applications!

dotTrace showing performance information about HelloWorld application

And finally, dotMemory will allow you to examine the memory allocations of .NET Core apps, too.

dotMemory analysing memory snapshot of HelloWorld application

All of this support for .NET Core is handled transparently by ReSharper Ultimate. You simply need to start profiling or coverage for a .NET application, passing in either of the stubs as the startup application, and ReSharper Ultimate will do the rest.

Also, this is initial support. There are a few things that aren’t working correctly just now, but we’re working on them, and they should be fixed in future EAP builds.

Grab yourself a copy of the latest EAP and give it a go. There’s more to come. Stay tuned!

The post Exploring .NET Core with ReSharper Ultimate appeared first on .NET Tools Blog.

Meet ReSharper 9.1, ReSharper C++ 1.0, dotTrace 6.1 and more ReSharper Ultimate product updates

$
0
0

We’ve just finalized a joint update to our .NET tools, added the first ever public version of ReSharper for C++, and as a result, the new release of ReSharper Ultimate is now available for download!

Specifically, this update consists of ReSharper 9.1, dotTrace 6.1, dotCover 3.1, dotMemory 4.3, dotPeek 1.4, and ReSharper C++ 1.0, a new product to join the ReSharper Ultimate family.

ReSharper Ultimate update

In addition to 770+ fixes, ReSharper 9.1 highlights include:

  • Improved support for Visual Studio 2015 and .NET 4.6. ReSharper 9.1 integrates actions based on Visual Studio Roslyn, so when you want to make changes to your code, you can choose either ReSharper or Visual Studio to do it for you, from the same list of Alt+Enter actions:
    Visual Studio actions in ReSharper menu
  • Better C #6.0 support that makes it easier to migrate an existing codebase to C# 6.0. In addition to such language constructs as static usings and exception filters, we’ve added support for string interpolation and the nameof() operator. To simplify the process of migrating your projects to C# 6.0, ReSharper now offers quick-fixes to transform your code in the scope of a file, project or the whole solution.Quick-fix to use nameof operator
  • JavaScript and TypeScript support improvements including JSDoc support, as well as improved TypeScript 1.5 and EcmaScript 6 support and full support for TypeScript 1.4.
  • New Evaluate expression context action that allows previewing the results of your code execution right in the editor. You can learn and play with most of .NET base class library APIs without even running your application. ReSharper can evaluate nearly full set of C# expressions, including LINQ and some new C# 6.0 constructs, so you get REPL-like experience directly in the code editor. Evaluate expression context action
  • Improved code completion: we’ve implemented a new mechanism that lets you order items by relevance so that the best fitting options are suggested higher in the code completion popup list.
  • Find types on NuGet. Copy-pasting code from StackOverflow has never been easier: When you have a type or namespace used inside your project that can’t be resolved to referenced libraries or packages, ReSharper can now search for this type or namespace in the NuGet package gallery, display the list of matching packages and easily download and install the package that you choose. As most great things about ReSharper, the search on NuGet starts with pressing Alt+Enter:
    Obtaining references from nuget.org in ReSharper 9.1
  • New Source Templates that can be created anywhere in the code of your project as extension methods and might be very handy in case you need to produce some repeatable code that is only relevant in your current project or solution.
    Source Templates in ReSharper 9.1

The other .NET tools in ReSharper Ultimate have been enhanced as well:

  • dotCover 3.1 enhances MSTest and WinStore tests support and ships numerous fixes for console tools.
  • dotTrace 6.1 receives the long-awaited SQL queries support in Timeline profiling: Now you can determine exactly how long a particular query executed for and what method ran the query.
  • The rich set of informative views in dotMemory 4.3 is extended with Dominators sunburst chart. With just one glance at the dominators’ hierarchy, you know what objects are crucial and how memory is retained in your application.
    Sunburst chart in dotMemory 4.3
  • Welcome dotMemory Unit framework — state-of-the-art .NET memory monitoring. Extend your unit testing framework with the functionality of a memory profiler. Please check more details in our recent blog post.
  • dotPeek 1.4 adds support for Visual Studio 2015 and C# 6.0.

In addition to these upgrades to our .NET tools, we are rolling out the inaugural release of ReSharper C++. A separate product for C++ developers who work in Visual Studio, ReSharper C++ inherits most features of ReSharper including its powerful navigation, coding assistance and code generation. To learn more, please visit the ReSharper C++ web site and watch out for new blog posts.

In terms of licensing and upgrades, there are several options available:

  • ReSharper 9.1 is a free upgrade for you if you have a valid ReSharper upgrade subscription or a per-major-version license to ReSharper 9. Updates to dotMemory, dotTrace and dotCover are free if you have a valid upgrade subscription to the respective product or to ReSharper Ultimate.
  • ReSharper C++ can be purchased as a separate license or as part of ReSharper Ultimate. For pricing and licensing options, see ReSharper C++ Buy page.
  • You may purchase a single license for ReSharper Ultimate, which includes ReSharper, ReSharper C++, dotTrace, dotCover, and dotMemory. Learn more about ReSharper Ultimate.
  • If you need a formal quote or any other assistance, you are welcome to contact JetBrains sales.

The post Meet ReSharper 9.1, ReSharper C++ 1.0, dotTrace 6.1 and more ReSharper Ultimate product updates appeared first on .NET Tools Blog.

Analyzing ineffective memory usage with dotMemory

$
0
0

Memory issues in .NET apps can be generally divided into 1) leaks, 2) large memory traffic, and 3) ineffective memory usage. In this blog we’ve written extensively about how dotMemory helps you deal with the first two problems. Now it’s time to talk about analyzing ineffective memory usage, especially since dotMemory 4.3 introduces a new feature that can help really fight this issue.

Before we move on, let’s agree on some terms. What is ineffective usage? When your app consumes more memory than it should, or could, we call this ineffective. Sometimes you just “feel” that a particular algorithm consumes too much, but nothing seems to explain why it does. That’s when you should use a memory profiler.

Assume you’ve done the profiling and taken a memory snapshot. What next?

There are two main analysis approaches that may be combined or used independently. Start by answering the following two questions:

  • What methods allocate the most memory?

  • What objects retain the most memory?

What Methods Allocate Most of the Memory?

This task is typically solved with the help of a call tree. Most memory profilers have a special call tree view for determining the calls that allocated the largest amounts of memory. Doesn’t sound too complicated, does it? But in fact, even for mid-size projects digging into the tree may become a headache.

Call Tree

Of course, this algorithm is applicable to dotMemory as well. However, since version 4.0 we offer a much easier way called Call Tree as Icicle Chart.

The idea behind the chart is simple – it’s a graphical representation of the call tree. Each call is shown as a horizontal bar whose length depends on the size of objects allocated in the call’s subtree. The more memory allocated in the underlying subtree, the longer the bar. The bar’s color value serves as an additional indicator – the more memory allocated by the call itself, the darker the bar.

Call Tree Icicle Chart

So instead of looking at lots of numbers, start your analysis by opening the Call Tree as Icicle Chart view. In just a glance you can match a certain call with the amount of memory it allocates.

For example, the following chart shows the same data as the Call Tree table in the GIF above. Notice how there’s no need to dive into the call tree: main memory allocations can be seen instantly.

Icicle Chart Example

Of course the chart is interactive: just click a call to see its call stack. Use the Shift+click combination to zoom into the chart and examine the call chain in more detail.

Icicle Chart

Who Retains the Memory?

Understanding how memory is retained in your app is essential for successful optimization. For example, you know that a major part of memory in your app is consumed by strings. Nevertheless, most likely, the subject of your optimizations is not these strings by themselves but the data structures that store them. That’s why “Who retains the memory?” is the next big question when analyzing ineffective memory usage.

Objects that exclusively retain other objects in memory are called dominators. Earlier dotMemory versions offered just one way of analyzing app dominators – the Group by Dominators view, which shows the tree of dominators sorted by retained memory size:

Group By Dominators View

Since version 4.3, dotMemory offers a new “visual” way of analyzing dominators: the Sunburst Chart. In this view, the dominators hierarchy is shown on a sunburst chart. The more memory a dominator retains, the larger the central angle.

Dominators Chart

A quick look at this chart shows what objects are crucial for your app and helps you evaluate the largest structures.

Sunburst Chart

If you click on a particular dominator, the Domination Path on the right will show you the retention path of this dominator. Double-click on a dominator to zoom into the chart and see the objects retained by this dominator in more detail.

Our experience shows that Dominators chart is also very effective when you need to quickly evaluate how a certain functionality works in your app. For example, below are two charts built for an image editor application: the first one was plotted before anything is done in the app, and the second one reflects memory usage after the user has applied an image filter.

Example of Two Dominators Charts

After some time, if you profile your app constantly, you’ll even be able to “see” not only how your app works, but even how particular changes in code affect memory usage.

Thanks for reading! We hope this post was helpful. Give dotMemory 4.3 a try and explore the Dominators and Call Tree charts.

The post Analyzing ineffective memory usage with dotMemory appeared first on .NET Tools Blog.

ReSharper Unified Installer. Why?

$
0
0

The ReSharper 9 release introduced a special ReSharper Ultimate bundle. In addition to ReSharper and ReSharper C++, this bundle includes our other JetBrains .NET products: dotCover, dotTrace, dotMemory, and dotPeek.

What made this bundle possible? In the pre-Ultimate era, customers using multiple JetBrains .NET tools together experienced serious performance issues. For ReSharper 9, we worked on a ‘shared platform’ to eliminate this performance overhead. This decision also led to the following:

  • All .NET products are now released on the same day.

  • ReSharper 9 and other shared-platform tools cannot be installed side-by-side with their predecessors onto the same Visual Studio instance. For example, after you installed dotCover 3.0 with switched on VS integration, you would find ReSharper 8 uninstalled. Unpleasant, but unfortunately inevitable.

  • Now, there is only one unified installer for all JetBrains .NET products. Whether you get ReSharper Ultimate, ReSharper, dotTrace, dotMemory, or dotCover, you will download the same installer (though it has different names depending on the product).

The latter consequence, in turn, created another concern. Even if the downloaded installer implies the installation of a single product (say, dotCover), it will contain installation options for our entire .NET product lineup.

Unified Installer

You may ask? “What are all these options for? What can/should I install?“. Of course, you can select just the tool you’re interested in and skip everything from the Available Products section. However, we recommend that you try installing all. Now let us explain why:

  1. No problems with trial licenses
    Having all these Available Products in the installer doesn’t mean you have licenses to the corresponding tools. In fact, the installer is absolutely unaware of this as applying a license is a post-installation step.
    Nevertheless, even if you don’t have a license to a particular tool, that’s OK, as any installed tool automatically gets a trial license. So, you’ll have from 5 to 10 days to give it a try.
  2. No annoying license notifications
    Even after the trial license expires, it will NOT bother you with notifications when Visual Studio starts up (this was really annoying in previous versions). The notification will be shown only in case of an explicit action, e.g. after you try to run profiling with an expired dotTrace license.
  3. More comprehensive development experience 
    This is a good opportunity to try all of the tools and decide whether you need each one in your work. For example, many developers neglect profiling their apps, not realizing that one profiling session may be all that’s needed to reveal a severe yet easily fixable bottleneck.
    Our vision of ReSharper Ultimate is that of a single product that covers most needs a .NET developer may have, rather than a set of separate products. In line with this vision, in ReSharper 9 we discarded separate .NET tool menus. Now, ReSharper’s menu is the only starting point for all your activities with all JetBrains .NET tools:
    R# Menu
    Of course, this is just the beginning and we plan to make this integration even deeper.
  4. Almost no performance penalties
    As we mentioned earlier, it doesn’t matter how many JetBrains .NET tools are currently installed in your Visual Studio. Thanks to the shared platform, there are virtually no performance costs. Nevertheless, if you don’t need a particular tool for your project, you can reduce its impact to zero by disabling it in ReSharper’s Products and Features:
    R# Products and Features

We hope this post answers most of the questions you may have had about the installer. If not, please post them in the comments below. Thanks!

The post ReSharper Unified Installer. Why? appeared first on .NET Tools Blog.

Welcome ReSharper 9.2, ReSharper C++ 1.1 and More Ultimate Updates

$
0
0

This is to let you know that a fresh update of ReSharper Ultimate tools is now available for download!

This update consists of ReSharper 9.2, ReSharper C++ 1.1, dotTrace 6.2, dotCover 3.2, dotMemory 4.4 and dotPeek 1.5. Let’s take a quick look on what’s new in each of them.

ReSharper 9.2

In addition to almost 400 fixes, ReSharper 9.2 release includes:

  • Improved support for Visual Studio 2015 RTM. ReSharper 9.2 refines integration with Visual Studio 2015 RTM, addressing issues discovered in versions 9.1.2 and 9.1.3.
  • Support for Windows 10 Developer Tools. ReSharper 9.2 provides code completion for API checks and supports new Windows 10 specific constructs.
    Code completion in ReSharper Api checks
  • JavaScript and TypeScript support enhancements including full support for TypeScript 1.5 and ECMAScript 6 and support for regular expressions. Regular expression support for JavaScript in ReSharper 9.2
    Going further in supporting new language versions, ReSharper 9.2 is already aware of such TypeScript 1.6 features as local types, abstract classes, type predicates, async functions and methods and the await operator. Moreover, Go to type of symbol navigation option is now available from the Navigate to menu:
    Go to type of symbol in ReSharper 9.2
    Stay tuned for more details on how ReSharper 9.2 enhances JavaScript and TypeScript support.
  • Run configurations. This is a brand new feature that allows you to create, manage, and execute multiple run configurations in a single solution. A run configuration lets you run, profile or debug a project, a static method or any executable file. For static methods, a run configuration can be quickly created right in the editor:
    Run Configuration from a static method
    You can create multiple run configurations depending on your needs and preferences. To run or debug the active configuration, press Ctrl+F5 or F5. By default, the solution will be rebuilt, but you can also execute the active configuration without rebuilding. If you have dotTrace installed and integrated in Visual Studio, you can launch profiling from the same pop-up menu: 

    Profiling run configuration in ReSharper 9.2

  • A reworked Go to Usages navigation pop-up (which is a non-modal version of Find Usages). The Go to Usages pop-up now shows the context of discovered usages, as well as a progress bar, which can be very handy when looking at heavily used symbols.

ReSharper C++ 1.1

ReSharper C++ 1.1 comes with a variety of updates, such as:

  • Google Test support. ReSharper C++ 1.1 introduces a unit test runner for Google Test that lets you invoke tests and test cases contextually from the editor. Similar to the mainline ReSharper, it comes with Unit Test Explorer and Unit Test Sessions tool windows to view, group, filter and run unit tests, as well as to create and manage unit test sessions. You can also add individual tests to sessions right from the text editor, via the Alt+Enter contextual menu.Google test support in ReSharper C++
    Please note that profiling and code coverage options are not applicable to Google Test sessions.
  • Includes Hierarchy view helps visualize dependencies between #include directives.Hierarchy of include directives in ReSharper C++
  • Enhanced C++ core features support includes inline namespaces (С++11), binary literals and digit separators (С++14).
  • New live template macros for specifying expected types, expected variable names and the current namespace in new live templates that you create for your code bases.
  • Two new refactorings: Introduce namespace alias and Introduce field. Introduce namespace alias refactoring is available via Refactor this menu and can be applied to the initial occurrence or to all occurrences by selection:
    introduce_namespace_refactoring
    Introduce field refactoring allows to create a new field based on a selected expression, initialize it with the expression or from the constructor, and replace occurrences:Introduce Field refactoring in ReSharper C++ 
  • New code inspections to detect not implemented inline functions, redundant inline specifiers on a function definition and functions that can be const, as well as quick-fixes for these inspections. Automatic import now works with macros as well.
  • A set of performance improvements, most notably ensuring that quick-fixes are immediately available on solution load.

Watch this short video for an overview of what is new in ReSharper C++ 1.1:

The other tools in ReSharper Ultimate have received the following improvements:

With dotTrace 6.2 you can:

  • Analyze incoming HTTP requests of your web applications by means of a new filter in Timeline mode. You can get the exact data on how a particular HTTP request is processed.
    Incoming HTTP Requests
  • Create and profile ReSharper’s predefined run configurations with different run parameters for your startup project.
  • Instantly profile any static method in your code. Simply place the cursor on the method, press Alt+Enter, and in the action list select Debug | Profile ([profiling_type]).
  • Browse performance snapshots right in Visual Studio to delete or keep particular data for further analysis.

dotMemory 4.4 allows you to:

  • Automate the process of getting snapshots. Just set a particular condition and snapshots will be collected automatically after condition is met, such as significantly increased memory consumption or exact period of time.
    Get snapshot by condition in dotMemory
  • Enjoy recently released Sunburst diagram even more with improved navigation and performance.

dotMemory Unit framework 2.0 receives a stand-alone runner for continuous integration, and extends the list of supported out-of-the-box unit testing frameworks to XUnit, MBUnit, csUnit, MSTest, and NUnit. The latter two can also be run from Visual Studio with ReSharper.

dotCover 3.2

Adds integration with ReSharper 9.2 and a set of bug fixes. Check the release notes for more details.

Please note: Currently, MSTest coverage in Windows 10 applications developed in Visual Studio 2015 using the latest Windows 10 tools is not supported, this is scheduled for the next update.

Download them all

Here’s the obligatory big red button at the end of the post:


Get ReSharper now

Licensing and upgrade options

In terms of licensing and upgrades, here are the options available:

  • ReSharper 9.2 is a free upgrade for you if you have a valid ReSharper upgrade subscription or a per-major-version license to ReSharper 9. Updates to ReSharper C++, dotMemory, dotTrace and dotCover are free if you have a valid upgrade subscription to the respective product or to ReSharper Ultimate.
  • You may purchase a single license for ReSharper Ultimate, which includes ReSharper, ReSharper C++, dotTrace, dotCover, and dotMemory. Learn more about ReSharper Ultimate.
  • If you need a formal quote or any other assistance, you are welcome to contact JetBrains sales.

The post Welcome ReSharper 9.2, ReSharper C++ 1.1 and More Ultimate Updates appeared first on .NET Tools Blog.

Viewing all 306 articles
Browse latest View live