Where and when does a value in our program change? And what’s the state of values in each iteration, when debugging recursive functions? Two good questions that Rider 2020.2 EAP helps answer, with Data Breakpoints and Pin-to-Frame! (more…)
↧
Data Breakpoints and Pin-to-Frame – Debugger Updates in Rider 2020.2 EAP
↧
Write Object-Oriented TypeScript Well
TypeScript enables you to code using object-oriented principles and techniques, and Rider helps you write TypeScript more efficiently and easily. In this blog post, we’ll look at the object-oriented features provided by the TypeScript language, and how to use Rider to implement them.
↧
↧
.NET Annotated Monthly | August 2020
Summer is here, but at present in 2020 many people can’t go anywhere, so a "staycation" will have to do. No problem though, just sit back, relax, and browse the content from our .NET Annotated newsletter.
There have been some key historical events that have happened in August. In 1995, Microsoft shipped Windows 95! Windows 95 was the "moment you’ve all been waiting for". I remember uncovering that Windows 95 Easter Egg with great delight! In 1981, IBM introduced its personal computer, IBM model 5150. When Windows 95 shipped, many folks were using IBM personal computers to run it.

↧
Generate Reference Assemblies With Refasmer
With each passing day, the .NET ecosystem introduces new target environments. In addition to Windows environments, we can now deploy to Linux, macOS, and all popular mobile operating systems. Having these options is excellent, as it allows us to reach a broader audience, but each new environment comes with its own set of challenges.
.NET Framework has solved the multiple-environments issue by creating the .NET Standard. The .NET Standard exposes a common API we can compile against with the understanding that our target environments have a context-specific implementation. In this post, we’ll see how we can take one of our own common assemblies and build a reference assembly.
What are reference assemblies?
According to the Microsoft documentation:
Reference assemblies are a special type of assembly that contains only the minimum amount of metadata required to represent the library’s public API surface. — Microsoft Docs
Reference assemblies allow us to build for a target environment within a different environment. For example, we may want to build our assemblies to target mobile devices from our Windows continuous integration environment. The most common reference assembly being the .NET Standard itself. In general, we can think of reference assemblies as contracts that concrete implementations can support.
Who can benefit?
Who benefits the most from using reference assemblies? That would be folks building APIs that target multiple environments. For example, we may be building a cross-platform microphone API. Our new microphone library shares a standard interface across environments, but because of the target operating systems like Windows, macOS, and Linux, we need unique implementations to make our API work.
Additionally, Reference assemblies allow platform developers to publish only the API surface, holding the implementation back at the time it is needed by developers. Reference assemblies are an ideal solution for products with a plugin system (all JetBrains products for example).
Product developers can publish reference assemblies to help plug-in authors understand the API surface while retaining the implementation details within the product. The product can continue to iterate with enhancements and bugfixes, changing internal implementation details without plug-in authors needing to update any references.
In the case of JetBrains, we required reference assemblies to target .NET Framework 3.5, which we were able to create with our own tooling. The .NET Framework 3.5 reference assemblies are made available on NuGet for anyone still targeting older versions of .NET Framework. This allowed us to support our loyal developer community working on older versions of .NET while still pushing to the future. The .NET Framework 3.5 reference assembly is a rebuild of the public API surface built from scratch and not just a stripped original assembly.
Enter Refasmer
JetBrains developers Sergey Zabodalov and Mikhail Filippov have developed Refasmer, a command-line tool that can take an assembly and generate a reference assembly. As stated before, our newly created reference assembly is a contract that can help us target new environments.
Currently, the tool is only available on GitHub.
To use Refasmer, we need to invoke RefasmerExe.exe with specific arguments found under the help menu.
RefasmerExe.exe -v -O ref -c *.dll
The command above will handle all DLLs in the current directory, continue on errors, and try to strip native resources. Refasmer will place output DLLs in the ./ref directory.
There is a wealth of options, which we can find in the help menu of Refasmer.
RefasmerExe.exe [options] <dll> [<dll> ...]
Options:
  -v                         increase verbosity
  -q, --quiet                be quiet
  -h, --help                 show help
  -c, --continue             continue on errors
  -O, --outputdir=VALUE      set output directory
  -o, --output=VALUE         set output file, for single file only
  -r, --refasm               make reference assembly, default action
  -w, --overwrite            overwrite source files
  -l, --list                 make file list xml
  -a, --attr=VALUE           add FileList tag attribute
Refasmer has the advantage of being a stand-alone executable, making it easy to integrate into continuous integration environments.
Conclusion
Refasmer is available on GitHub for folks looking to make the process of building reference assemblies easier. Sergey and Mikhail have done a great job and released the code for the benefit of the .NET community. Contributions and feedback are welcome.
↧
Debugging Unity Players over network and USB with Rider 2020.2
Rider 2020.2 is a bumper release for Unity. We’ve already seen how “pausepoints” can help you debug your code, by switching the Unity editor into pause mode when your code hits a certain point. Let’s continue looking at how Rider can help with your Unity application.
We’ll stick with debugging for now, and in this post we’ll see how you can use Rider to debug your game on mobile devices and consoles such as iPhone, Android, Xbox and PlayStation.
We’ll follow up with another post looking at how Rider improves the default display of values while debugging, and then we’ll have a couple more posts detailing Rider’s Burst analysis, and then take a dive into, wait for it, shader support!
Rider has always supported debugging players, such as standalone desktop apps, mobile devices and consoles, but this release sees a number of new features, a bit of polish and a couple of bug fixes to make it even better. It also introduces USB debugging for Apple devices.
Player discovery
It’s nice and easy to start debugging a player, simply use the Attach to Unity Process action, available in the Run menu, or in the drop down menu when you click the Unity logo in the main toolbar.
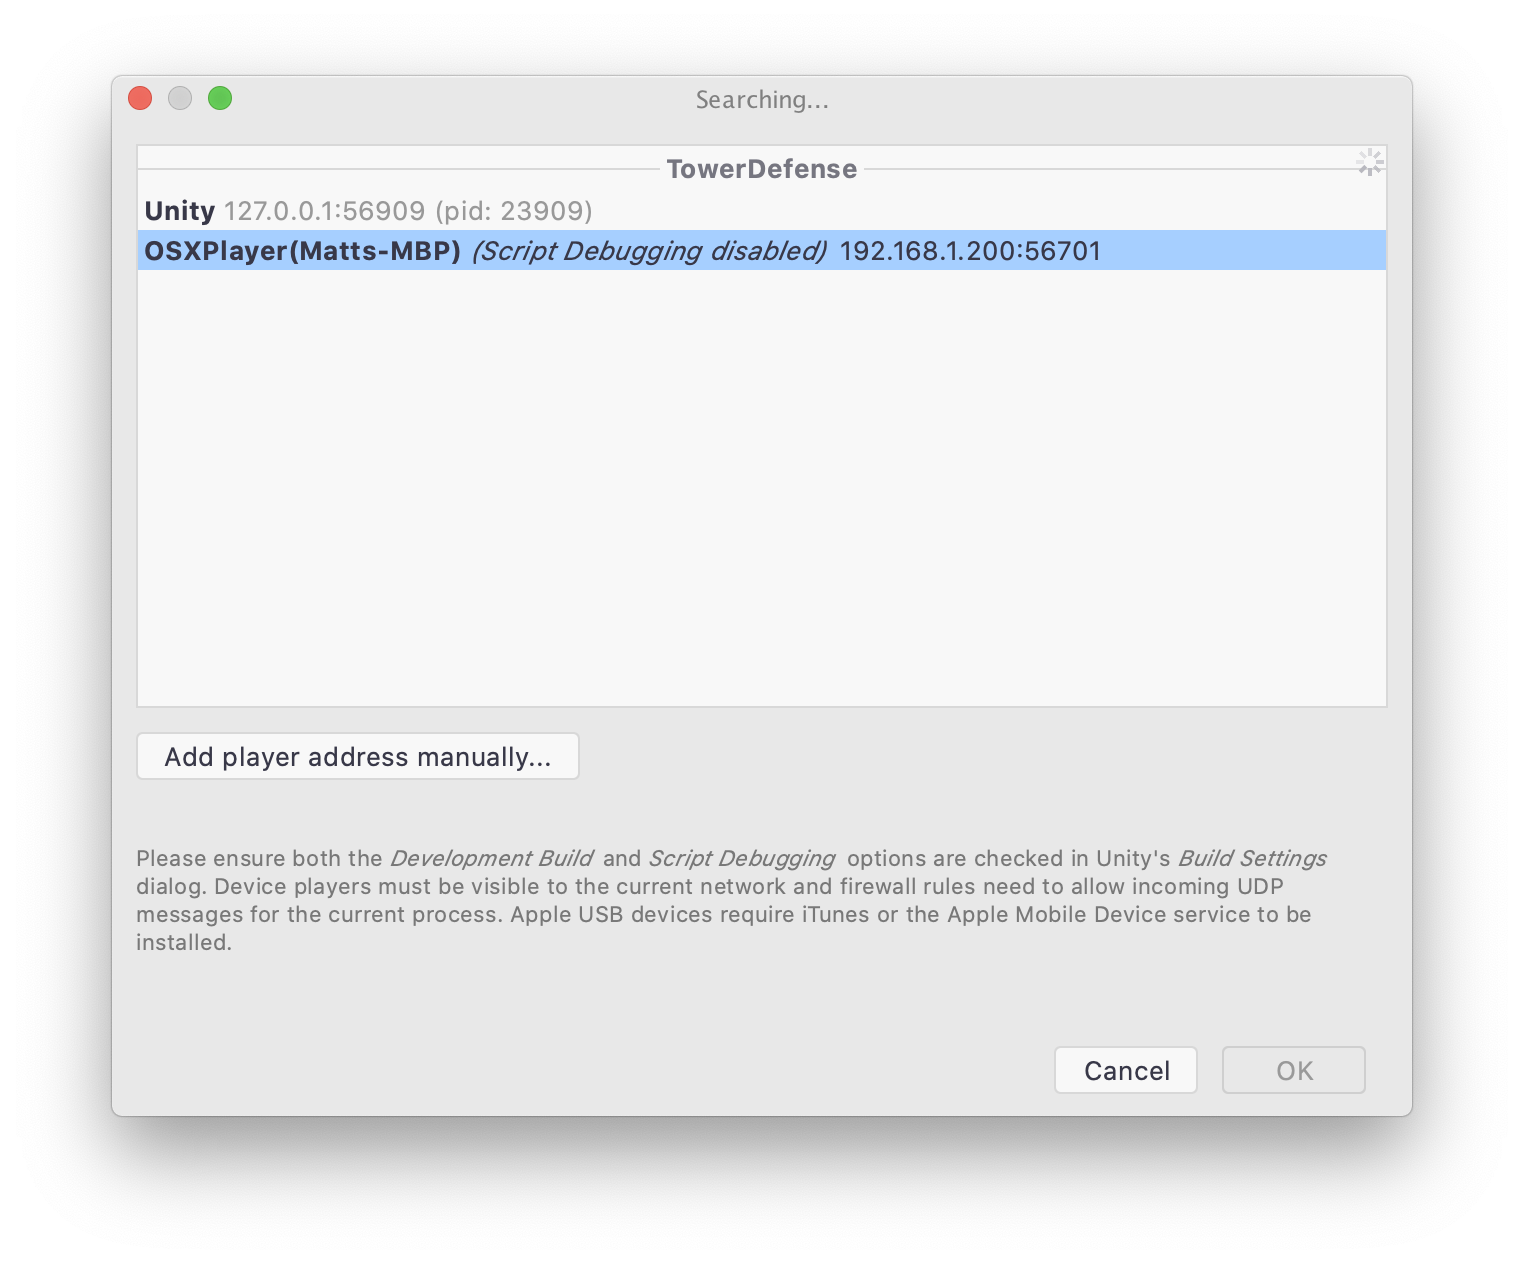
This will open the Attach to Unity Process dialog, which lists the available processes to debug. This dialog has had a little polish in this release, and now groups the players by project, with the currently open project at the top of the list.
Looking back at the screenshot of the dialog, you can see that there can be quite a few different processes listed. Let’s take a look at what Rider is going to show you. Rider will list all editor processes, grouped by project when possible, with the current project shown at the top of the list. You can attach the debugger to the editor from this dialog, or you can use the Attach to Unity Editor run configuration and just click the Debug button in the main toolbar.
Rider will also list any helper processes created by the Unity editor, shown as a child of the main Unity editor process. This is useful for debugging features that Unity runs out of process, such as asset import workers for the new DOTS system.
Rider will then list all other players for the current project. This includes standalone players such as the Windows or OSX player, followed by remote players, such as mobile devices or consoles.
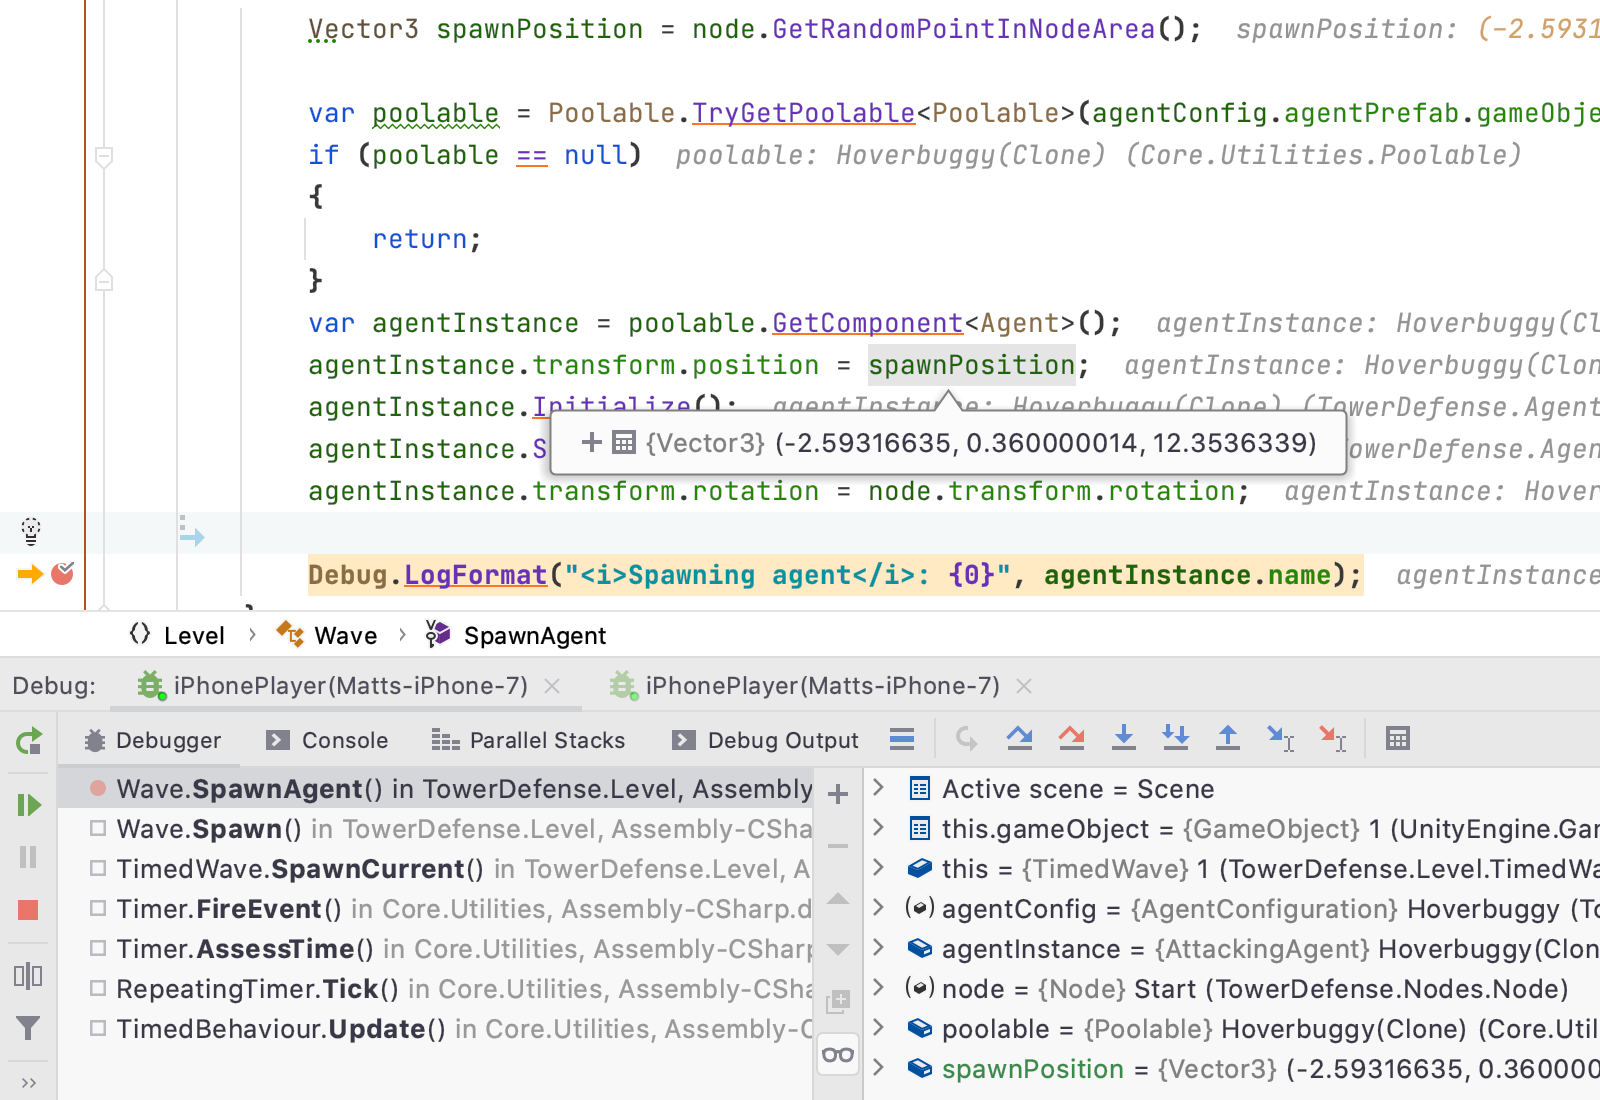
Selecting an item in the list and clicking OK will start the debugger (double-click the item if you’re in a hurry), and that’s it! You’re now debugging your game running on a device. Rider’s debugger features work just the same as if you’re debugging a local process – local variables, watch variables, evaluating expressions and calling methods and so on. And everything works great with cellular devices such as phones that can connect to the internet via WiFi or their own cellular radio.
Apple USB debugging
New to Rider 2020.2 is debugging of Apple devices over USB. You can now debug your iPhone or iPad game via network, or over a USB connection. This can be really useful if your device isn’t able to connect to the same network as your desktop, or if your local WiFi is being a little flaky, or simply as a preference.
It all works seamlessly – the connected iPhone or iPad is listed in the “USB Devices” group, and you can simply select or double click and you’ll start debugging, just the same as over the network.
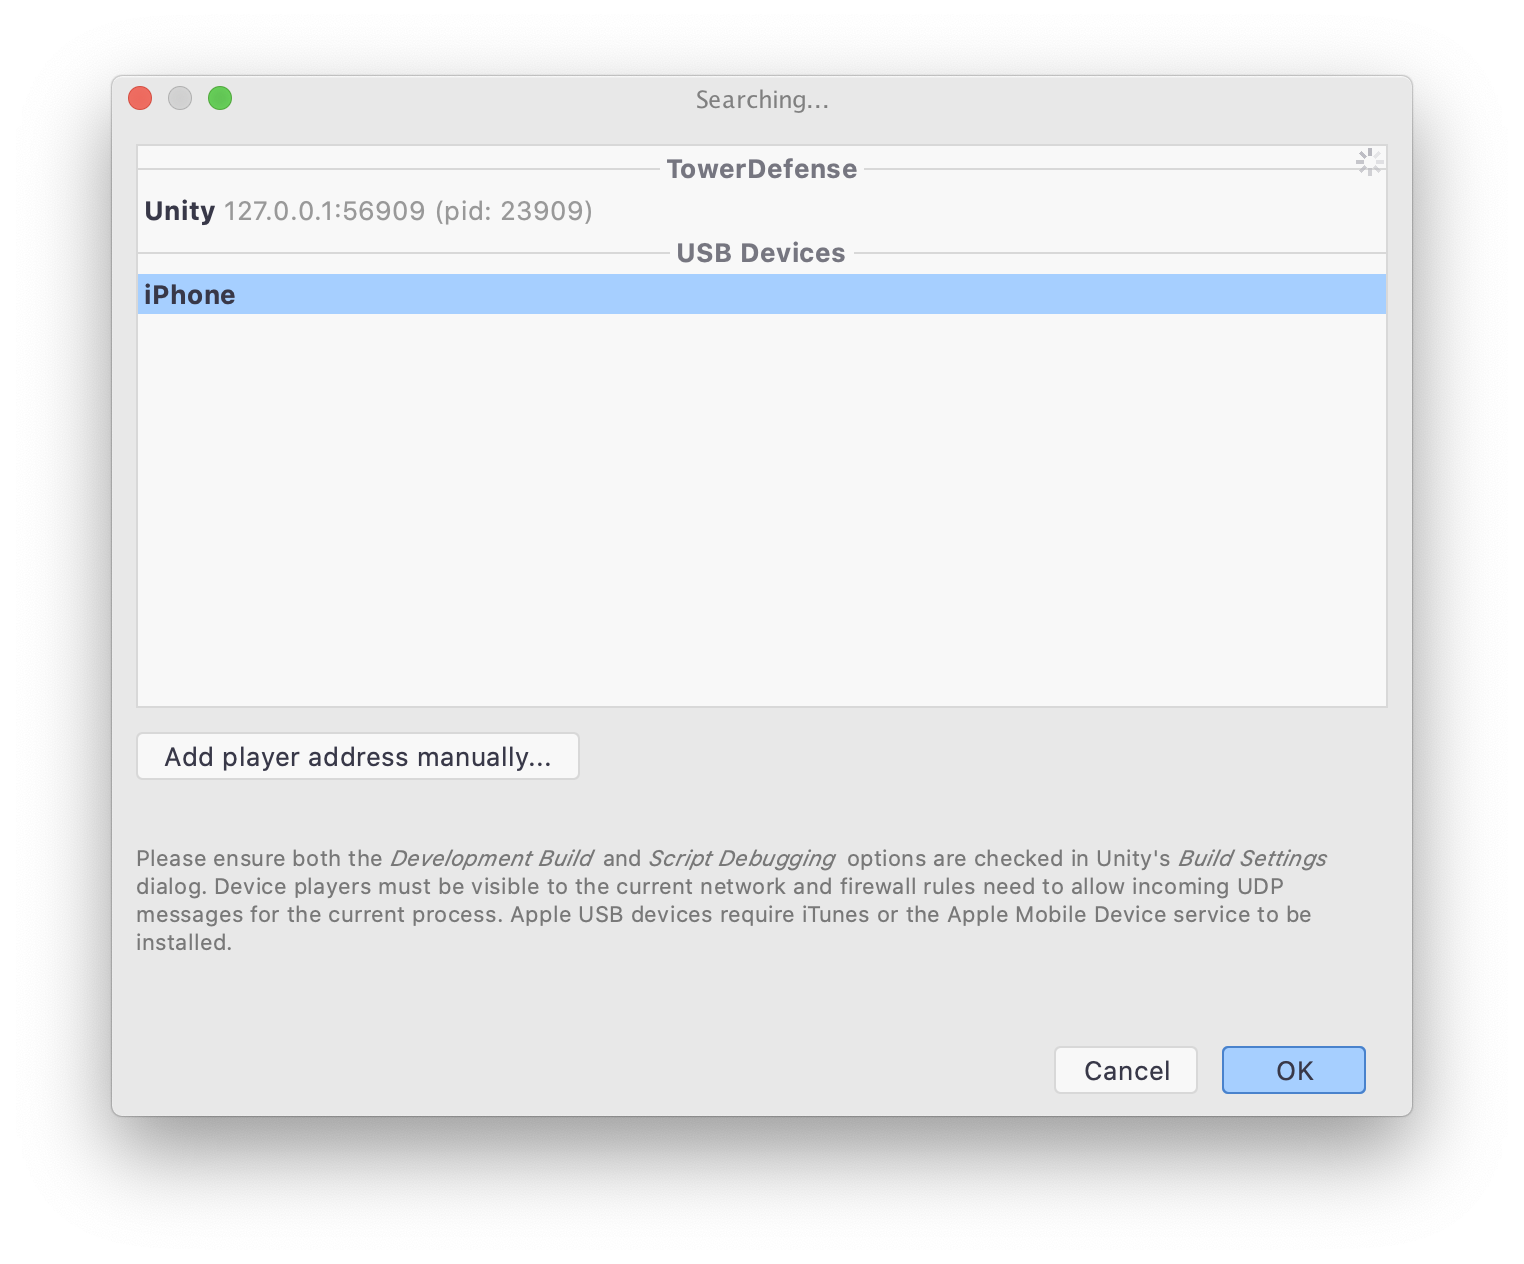
Rider doesn’t have much information about the connected device, so it’s lised simply as iPhone or iPad. And Rider also doesn’t know what’s running on the device, so you won’t get a project name, and in fact, you’ll see the device in the list even if your Unity game isn’t running!
The obvious question now is “what about Android?”. Rider doesn’t currently support USB debugging for Android, but you can still debug your Android game over the network. We’re planning on adding Android USB debugging in Rider 2020.3.
Manual player discovery
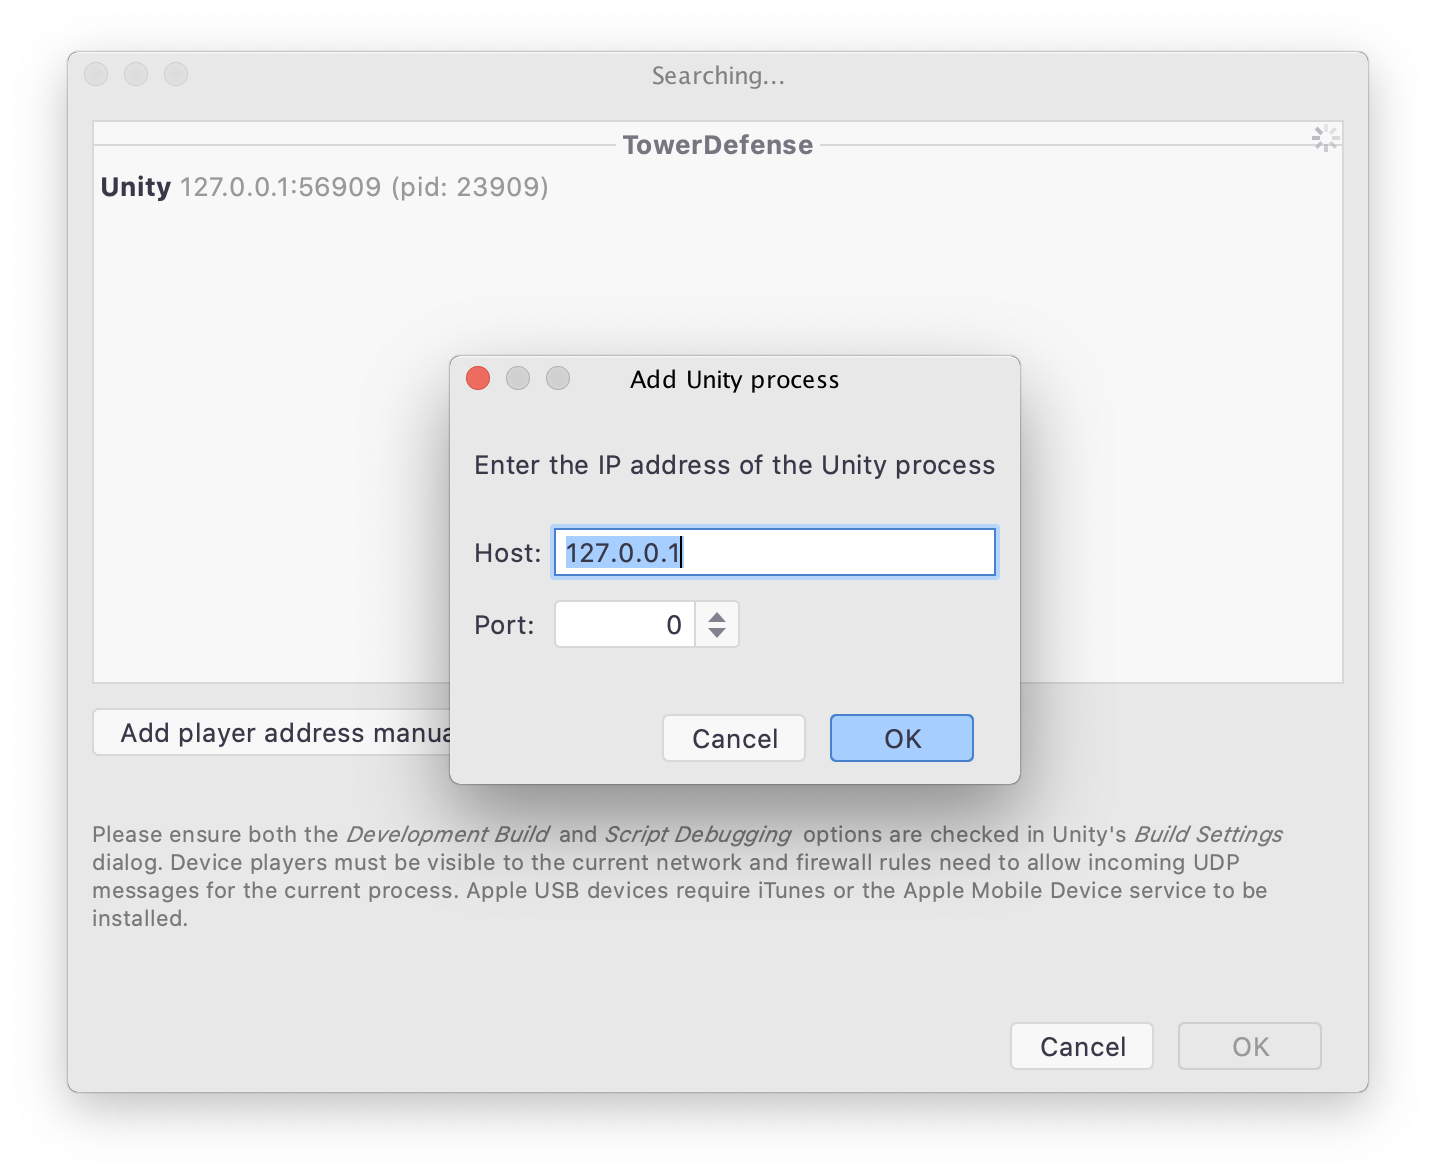
If for some reason the player doesn’t show up in the list, and you can find the device IP and port number from the player logs, you can use the Add player address manually button to enter the custom network details and connect the debugger manually.
Debugging and profiling standalone players
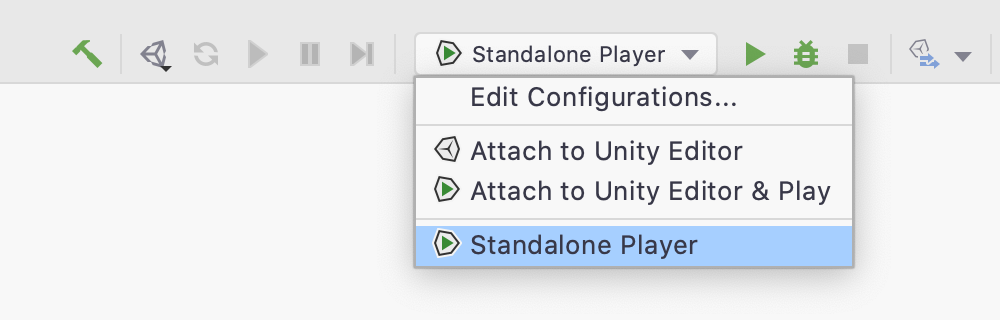
One other thing that Rider 2020.2 will do is to create a new run configuration when you build a standalone player. Rider’s plugin for the Unity editor will spot that a standalone player, for Windows, Mac or Linux, has been created, and will automatically create a run configuration called simply “Standalone Player”.
Once the run configuration is selected, the Run button will launch the desktop player. The Debug button will launch the process and attach the debugger. And you can even use the Profile button to launch the process and attach the timeline profiler to get a code focused profile of your standalone player.
You can find out more about profiling Unity executables in this blog post from Rider 2019.1 when we first introduced the feature.
Requirements
Now for the small print!
On the whole, it’s very easy to build and debug players from your Unity project, but there are a couple of required steps to make sure things work smoothly. You can read the details in Unity’s documentation (see the Troubleshooting the debugger section), but the TL;DR is that firstly, the player build must have Script Debugging enabled. If it doesn’t, Rider will highlight this in the dialog, and you’ll be unable to attach to the player.
Secondly, you need to make sure that the remote device is visible to your desktop’s network, and that firewalls aren’t blocking any traffic. The players broadcast their debug details via UDP messages, and if there’s a firewall blocking this, the player won’t appear in the list.
Finally, the version of Unity that you use to build your player makes a difference, too. If your player is built with a Unity version earlier than 2019.3, then you won’t see a project name – only players built with Unity 2019.3 and above broadcast this information. Rider will still happily debug older players, but they will be grouped under “Unknown projects”.
And you’re not limited to the Mono backend either – Unity 2018.2 added support for debugging IL2CPP based players as a normal C# application, so Rider is able to debug Mono or IL2CPP players.
Download Rider 2020.2!
As you can see, Rider makes it easy to debug your Unity game. It’s very easy to attach to the Unity editor from the main toolbar, and the Attach to Unity Process dialog lists Unity editors, helper processes, local standalone players, remote players on devices and consoles and even Apple devices attached by USB. You can even launch, debug and profile standalone players with a single click!
Next time, we’ll take a look how Rider 2020.2 improves the default display of locals and variables in the watch window.
Download Rider 2020.2 EAP today, and try it with your own game. We’d love to hear your feedback!
↧
↧
ReSharper 2020.2: Improved Code Analysis for C# 8, Code Cleanup on Save, and Revamped Unit Test Runner
Hello everyone,
Today we’re excited to give you ReSharper 2020.2! This major release introduces new inspections and quick-fixes for C# 8, most notably for nullable reference types, a much-awaited Code Cleanup on Save, a revamped Unit Test Runner, and various accessibility improvements.
Since the ReSharper license now covers both ReSharper and ReSharper C++, support for C++/CLI – a bridge between the languages – is getting a lot of updates and improved interoperability between C++/CLI and C#.
Read through the major updates of all the JetBrains .NET tools and extensions:
Also, visit our What’s New page for the full release notes.
ReSharper 2020.2
Code Analysis
C# 8 support has been improved with a number of new inspections and quick-fixes, most notably for nullable reference types. For instance, code analysis now takes into account JetBrains.Annotations attributes (both NotNull and CanBeNull) for API declared in code where nullable reference types are disabled (#nullable disable).

Also, nullability code analysis is now aware of more cases and can trace incorrect nullability through deconstruction and the foreach cycle. It also provides a corresponding quick-fix.
Code Cleanup on Save
Finally, you can set up ReSharper to launch Code Cleanup automatically on saving a file! We’ve also added more granular scopes to run Code Cleanup for recently modified or recently opened files.

Revamped Unit Test runner
We’ve remade our Unit Test runner from scratch for both .NET Framework and .NET Core, which allows us to use the same runner for both runtimes that run out of the Visual Studio process. This has helped us solve quite a lot of problems with discovering, running, and debugging unit tests, and gives us full control over unit test hierarchies for .NET Core tests. What’s more, the new test runner has built-in MSFakes support for the NUnit, xUnit, and MSTest v2 unit test frameworks.

In other news:
-
We have good news for UWP developers – support for compiled bindings with
x:Bindis finally here! -
This release comes with improved support for screen readers like JAWS, NVDA, and Microsoft Narrator.
-
Type and project dependency diagrams have been updated. The yFiles engine, which is used to draw the graph, has been updated to the latest version. This, in addition to our optimizations, means the resulting graph is drawn much faster. Also, you can export the graphs to new file formats, GraphML and XPS.

-
Navigating to usages of types from external assemblies in the code is now much easier. ReSharper can navigate directly from Go to Type search results to Find Usages.
-
New Peek actions have been added to show the result of some common ReSharper actions in a Peek Definition view.

- We have updated our offline and online installers to cover all products under the dotUltimate license, which includes ReSharper, ReSharper C++, JetBrains Rider, dotCover, dotTrace, dotMemory, and dotPeek.
ReSharper C++ 2020.2
Improved Unreal Engine features
ReSharper C++ 2020.2 introduces support for the Unreal Engine project model, which brings smarter auto-import for include directives and support for different solution configurations. To match the Unreal Engine coding standard, we’ve also included several updates to inspection severities and code generation actions.

Better C++/CLI support
We’ve updated C++/CLI support to improve interoperability with C# code, and we’ve added a set of code inspections for the sealed, gcnew, and safe_cast usages. Upgraded search and navigation features now work on imported CLR entities and allow you to look for derived symbols in C# code.

See the ReSharper C++ 2020.2 blog post for more details.
Command Line Tools 2020.2
- ReSharper command line tools now run .NET Core on Windows, Linux, and macOS, and you can install them as .NET Core Global Tools.

- dotTrace, dotCover, and dotMemory command-line tools for Linux (Debian and Ubuntu) can perform analysis on ARM64 systems.
- In the dotCover console runner, the
--reportype=SummaryXmlparameter lets you create a new Summary report type, which includes data on how many classes, methods, and statements are covered in total. Now, the runner can generate reports of several types at once. - The dotTrace console profiler lets you control the profiling session (take snapshots, detach from the profiled process, and so on) by sending commands to stdin or to a file.
- The dotMemory command-line profiler is now also available on Linux and macOS, in addition to Windows.
dotTrace 2020.2
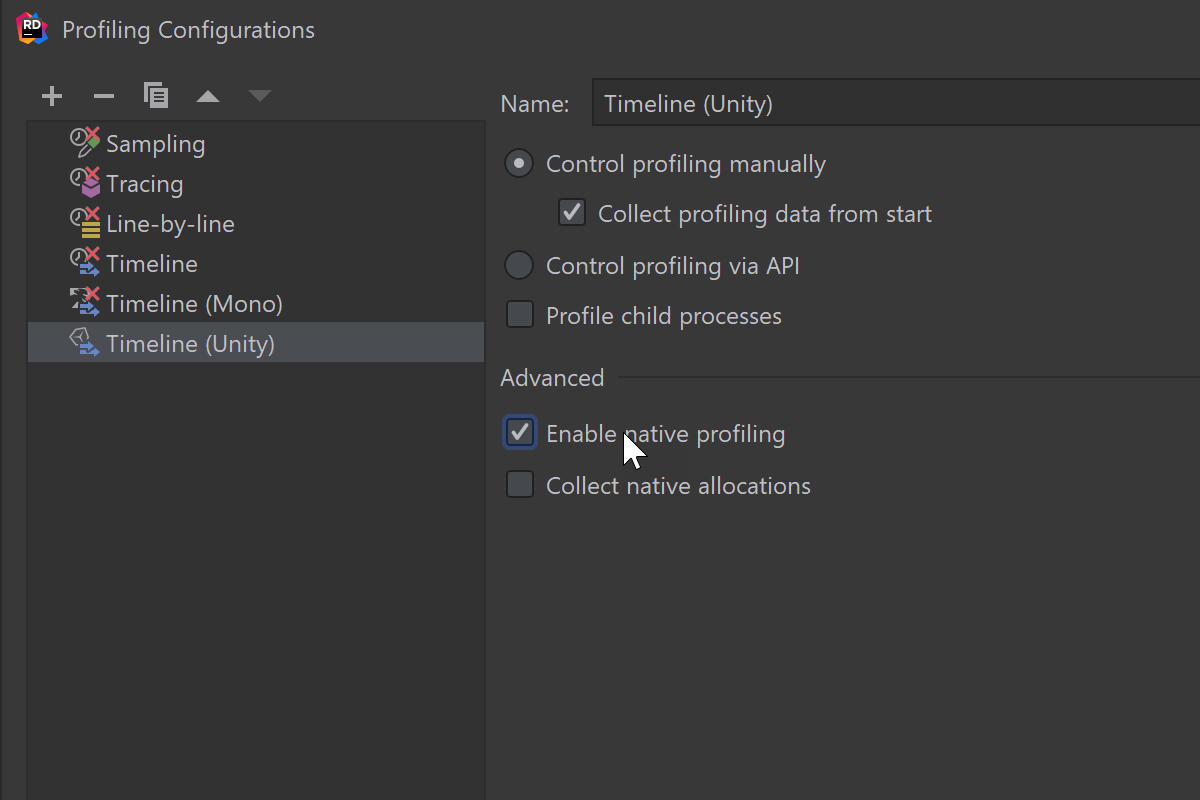
Both standalone dotTrace and dotTrace in Rider can profile the native part of Mono/Unity applications on Windows. Start a session with the ‘Enable native profiling’ option selected, and you’ll see both native and managed call stacks in the performance snapshots.

dotPeek 2020.2
- Improved NuGet support: NuGet v3 package feeds are now supported in Open from NuGet, Open from NuGet packages cache, and Open NuGet packages.config.
- The new release brings support for the most recent version of C#, including the following language features:
- Expression-bodied members
Throwexpressions- Default parameters and named arguments
NullablePublicOnlyattribute
See the full list of fixes completed in the 2020.2 release cycle on YouTrack.
Visit our What’s New in ReSharper page for the full list of improvements. Let us know what you think of this release and please share your feedback here in the comments, in our issue tracker, or on Twitter!
You can use any of these alternative ways to get ReSharper 2020.2:
- Download and install from www.jetbrains.com.
- Update right inside ReSharper: ReSharper | Help | Check for updates.
- Use our Toolbox App.
↧
Rider 2020.2: Localization Manager, Debugger Updates, and Major Updates to Unity Support

Rider 2020.2 is now available! To mark this great news we’ve put together a full list of the new features and under the hood improvements that are in store for you. Let’s dive in!
Debugger
The new release brings significant changes to the debugger API. They allow us to perform super-lazy value calculations with better interruption and custom value representation. We’ve also added data breakpoints.

Finally, the Pin to Frame feature lets you pin local variables to the frame.
Localization Manager
We’re proud to introduce a new tool for working with resources. With the Localization Manager, you can view the content of any specified set of .resx files in your project, including all of them at once, in a single grid.
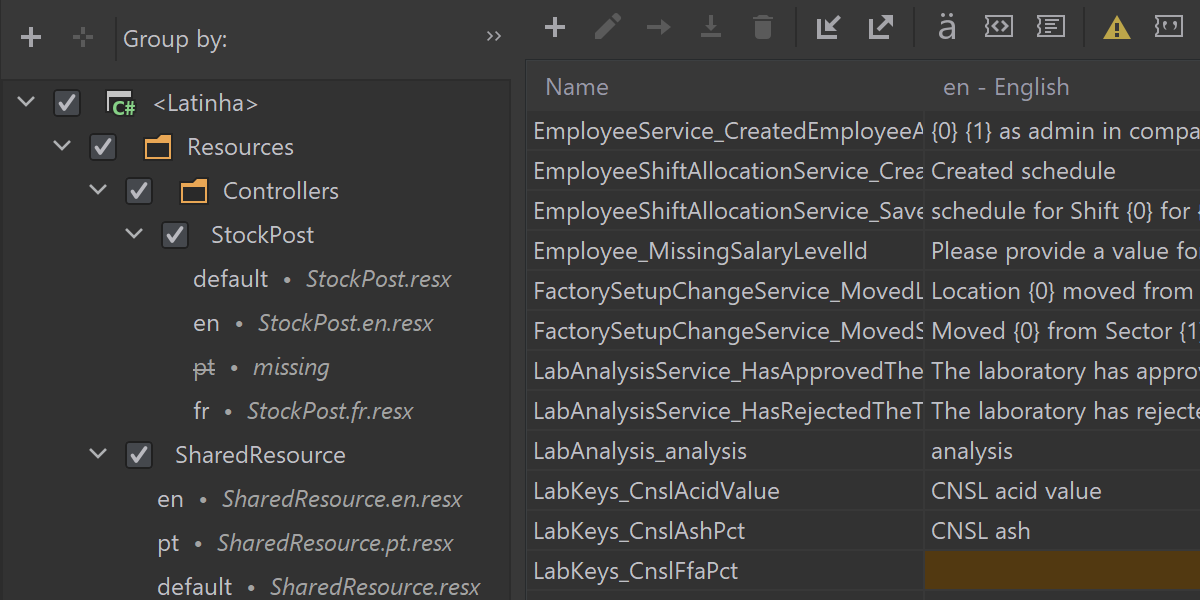
The Localization Manager allows you to easily perform the whole set of operations on resources: add, edit, rename, safely delete, find unused, find the resources missing localized values, find usages, export to and import from CSV, and add comments.
Unity
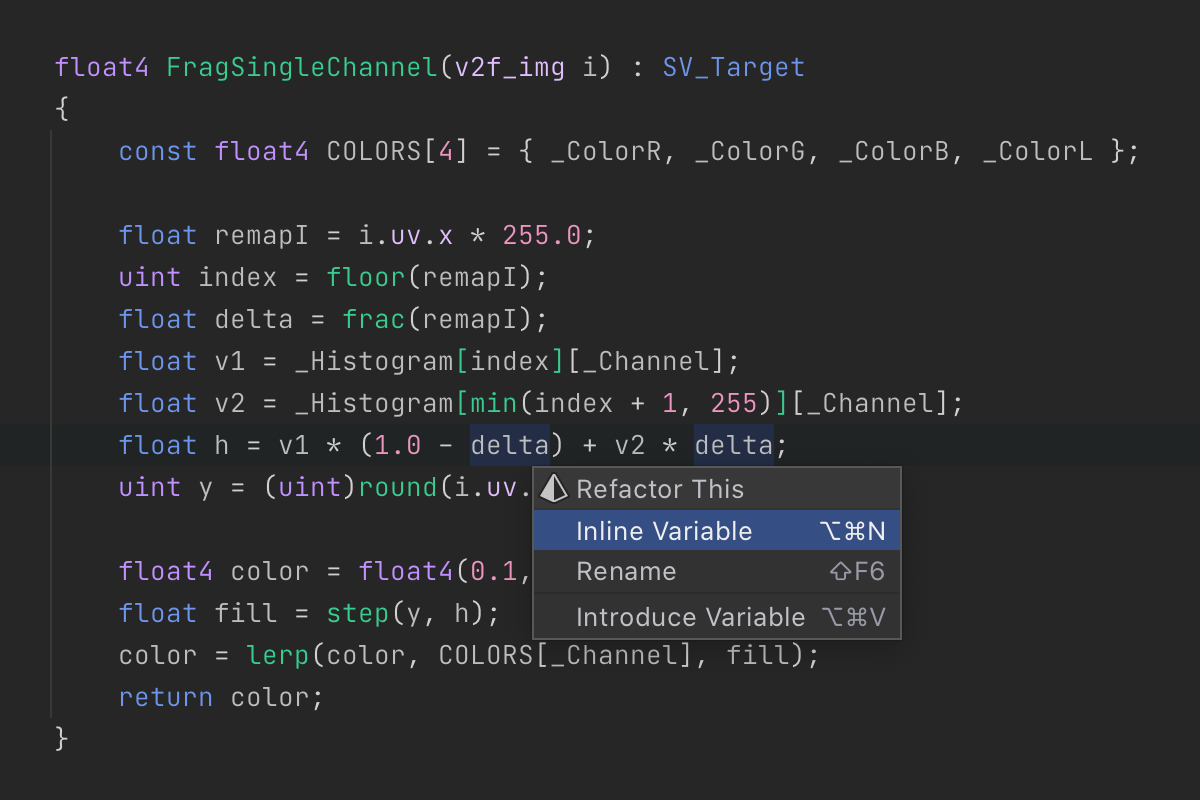
Unity support has received a major boost. Cg and HLSL shaders are now supported in syntax highlighting, code completion, navigation (including macros), refactorings, and more.
Pausepoints, which pause the Unity Editor when the debugger hits them, are now available. Rider now works with the Burst compiler, which means it highlights code that doesn’t match Burst constraints. For the whole list of improvements, check out this list.
VCS support
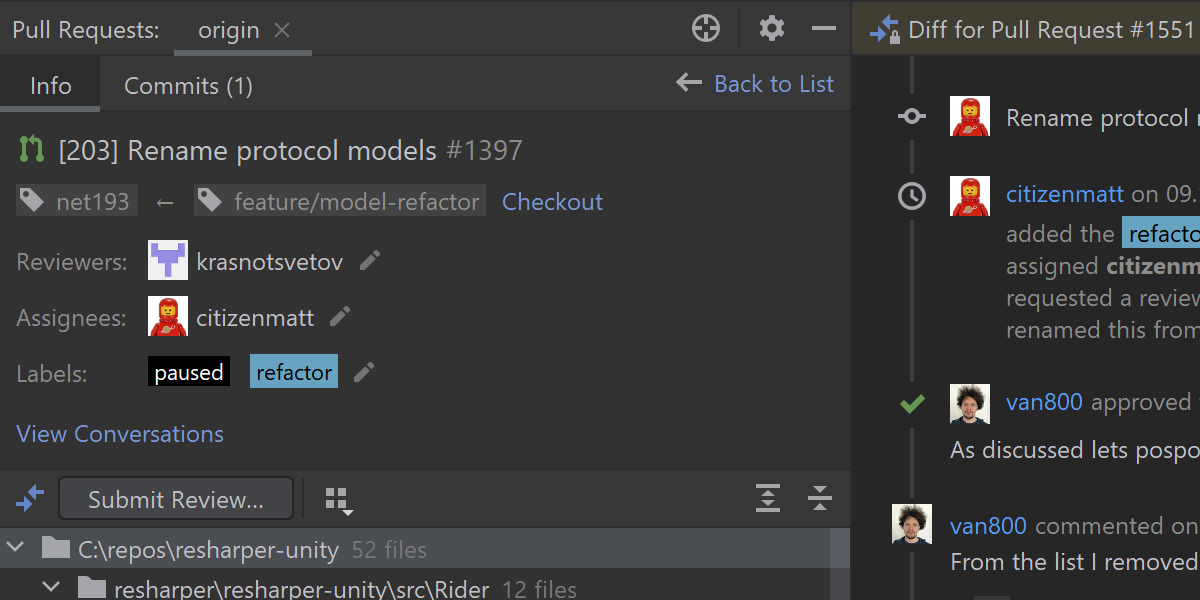
The main attraction here is the enhanced support for GitHub pull requests, which includes browsing, assigning, and merging pull requests, as well as submitting comments and reviews, accepting changes, and more. For more details, please check out this blog post.
Additionally, Git in WSL 2 is now supported, Compare branches are presented more conveniently, and you can squash commits selected in the Log tab of the Git tool window.
Unit testing
Our unit test runner has been rebuilt from scratch for both .NET Framework and .NET Core. This has helped us solve a lot of known problems with discovering, running, and debugging unit tests. The new runner includes built-in support for MSFakes for NUnit, xUnit and MSTest v2, along with the ability to run MSTest v2 tests without Visual Studio installed. There are also UI improvements for better presentation and filtering.
NuGet
The NuGet tool window has received a considerable feature boost. It now displays a solution’s transitive packages, provides a context menu with all the relevant actions for a single package, and indicates invalid feeds and deprecated packages.

Code analysis
C# 8 support has been enhanced with a number of new inspections and quick-fixes, most notably for nullable reference types. For instance, code analysis now takes into account JetBrains.Annotations attributes (both NotNull and CanBeNull) for API declared in code where nullable reference types are disabled (#nullable disable).
Also, nullability code analysis is now aware of more cases and can trace incorrect nullability through deconstruction and the foreach cycle, and it provides a corresponding quick-fix.
Refactorings
The Introduce Parameter and Introduce Field refactorings now ask which part of the expression you want the refactoring to be applied to.
The Conflicts dialog has received a makeover: we’ve turned the plain list into a tree grouped by file.
Plugins
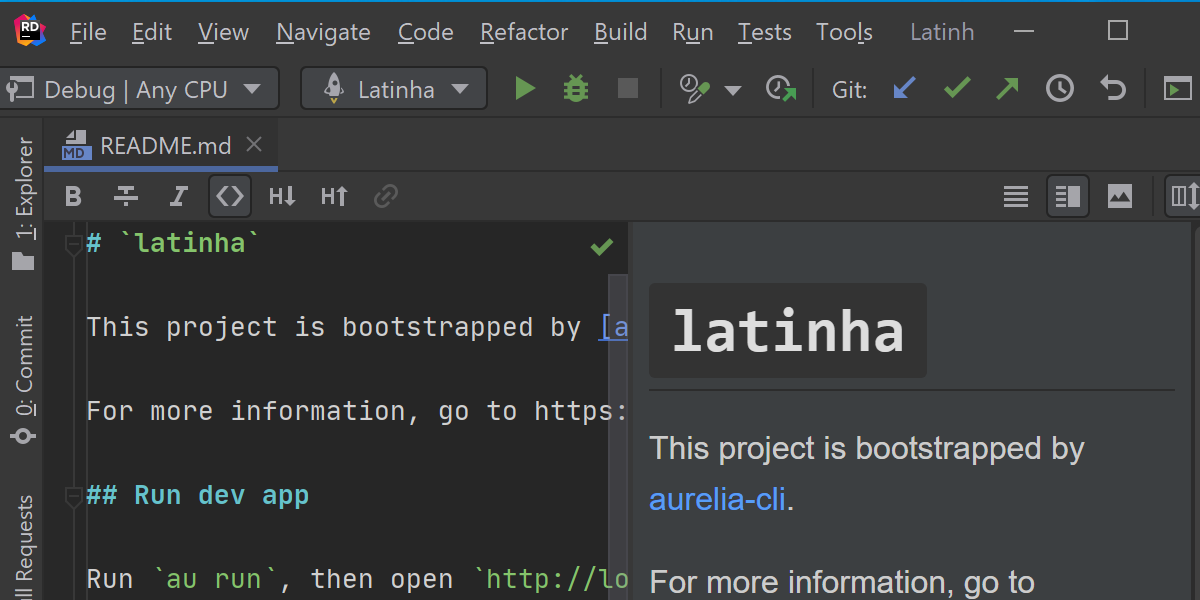
The Markdown plugin is now bundled in Rider. It recognizes Markdown files in your solution, provides a dedicated editor for them, and shows the rendered HTML in a live preview.
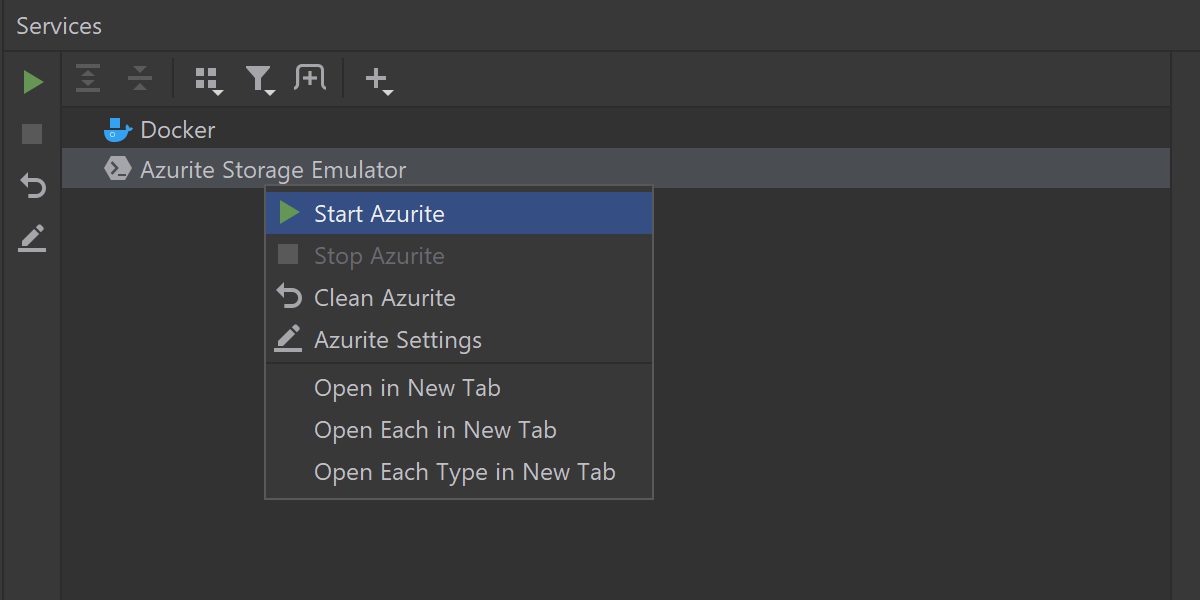
With Azure Toolkit and Azurite, you can now start, stop, and clear the storage emulator in the Azurite node of the Services tool window. Also, code completion and validation is now available when editing NCrontab expressions.
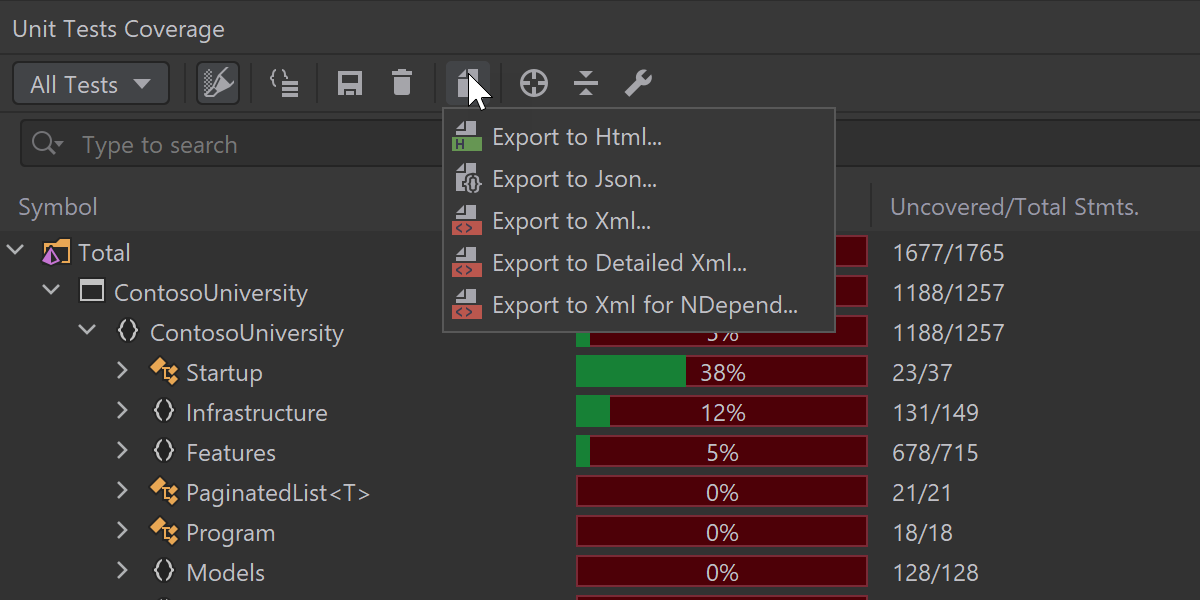
The dotCover plugin offers export of coverage reports, quick search in Unit Tests Coverage window, and navigation from code to the coverage tree.
The dotTrace plugin can profile the native parts of Mono/Unity applications on Windows.
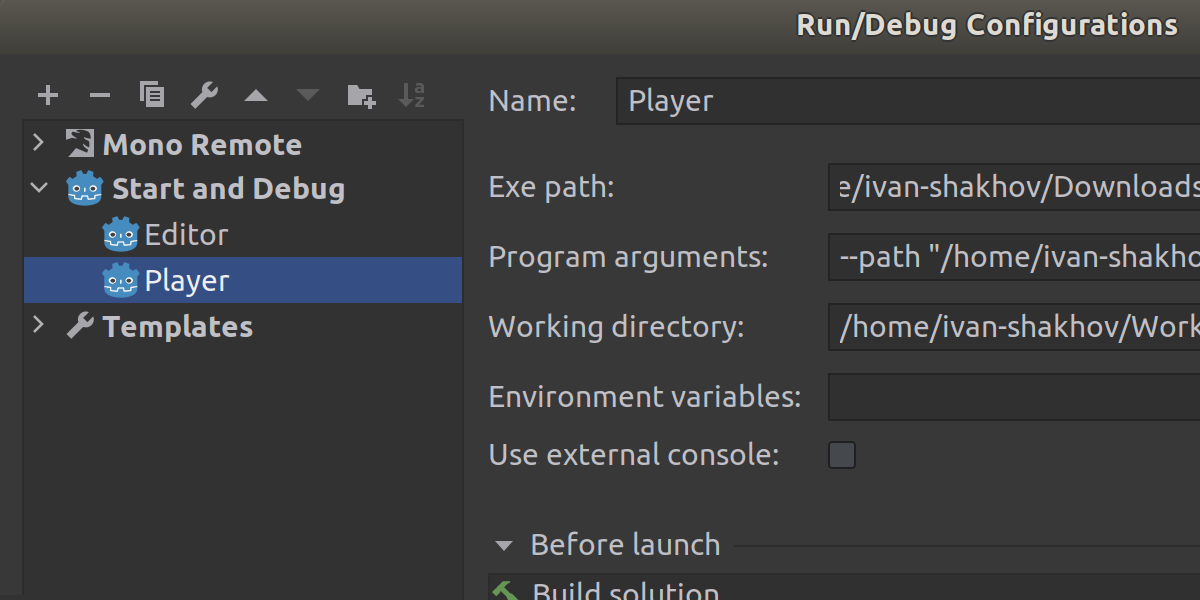
Godot run configurations have been reworked to make it easier to launch run, debug, and run with profiling.
Other updates
- We have a new installer for all the products covered by the dotUltimate license; to learn more about the updates to the licensing, please refer to the blog post.
- Support for compiled bindings with x:Bind is available with inspections and quick-fixes.
![]()
- File templates are now available in both Mac and iOS Xamarin projects. Xcode synchronization has been improved. If there is no .Designer.cs file, Rider now generates one instead of displaying an error.
![]()
- Dynamic Program Analysis now has include and exclude filters.
![]()
- New analyzers, highlighters, and quick-fixes have been added to the F# plugin. We’ve also taught Rider to rename the wildcard pattern and to apply the Introduce Variable refactoring to variables.
![]()
- We’ve made some improvements to database support, such as a separate editor for huge cell values, a new UI for boolean values, and a DML preview in the data editor.
![]()
- For web developers, we have new smart intentions in JavaScript code, in-text rendering of documentation comments, support for the Prettier plugin, and more updates to Vue support.
![]()
- We now support attaching the debugger to .NET core runtime hosting configurations and running them with debug.
- Run configurations are generated for all runnable projects.
- Project references for website projects are now supported.
- Search results in Search Everywhere have a new look.


See the full list of fixes completed in the 2020.2 release cycle on YouTrack.
That’s it for today! If you’re interested in learning more about these changes, please refer to the What’s New in Rider page. We appreciate your feedback, so please let us know what you think of Rider 2020.2 in the comments below, in our issue tracker, or on social media.
You can use any of these options to get Rider 2020.2:
- Download and install it from www.jetbrains.com.
- Update right inside Rider: Help | Check for updates.
- Use our Toolbox App.
- Use this snap package from the SnapCraft store if you are using a compatible Linux distro.
↧
Debugger Extensions for Unity in Rider 2020.2
Rider 2020.2 has a lot of great new features for Unity, and debugging has certainly had its fair share of attention in this release.
We’ve already introduced “pausepoints”, a new kind of breakpoint that puts the Unity editor into pause mode when a condition is met in code, allowing you to use the Unity Inspector to see what’s going on at that point. And in the last post, we saw how Rider can help you debug players, either standalone on the desktop, or on mobile devices and consoles, including USB support for Apple devices. Today, we’re going to look at a set of small features that will make a big difference to how you debug your Unity projects.
One of the problems with debugging a Unity game is understanding your current context – if you’re debugging a MonoBehaviour script, which game object is it attached to? Where is it in the object hierarchy? What other components are attached to the game object? What’s the position of this Transform?
All of these questions and more can be answered through the debugger, but that often requires drilling down into objects, or evaluating expressions and calling methods, making you work to find these answers, rather than having the most useful information quickly and easily accessible.
Rider has made a whole load of little tweaks to how we display Unity values in the debugger, all designed to give you a better view of the current state of your project, and to make it easier to see this much needed context.
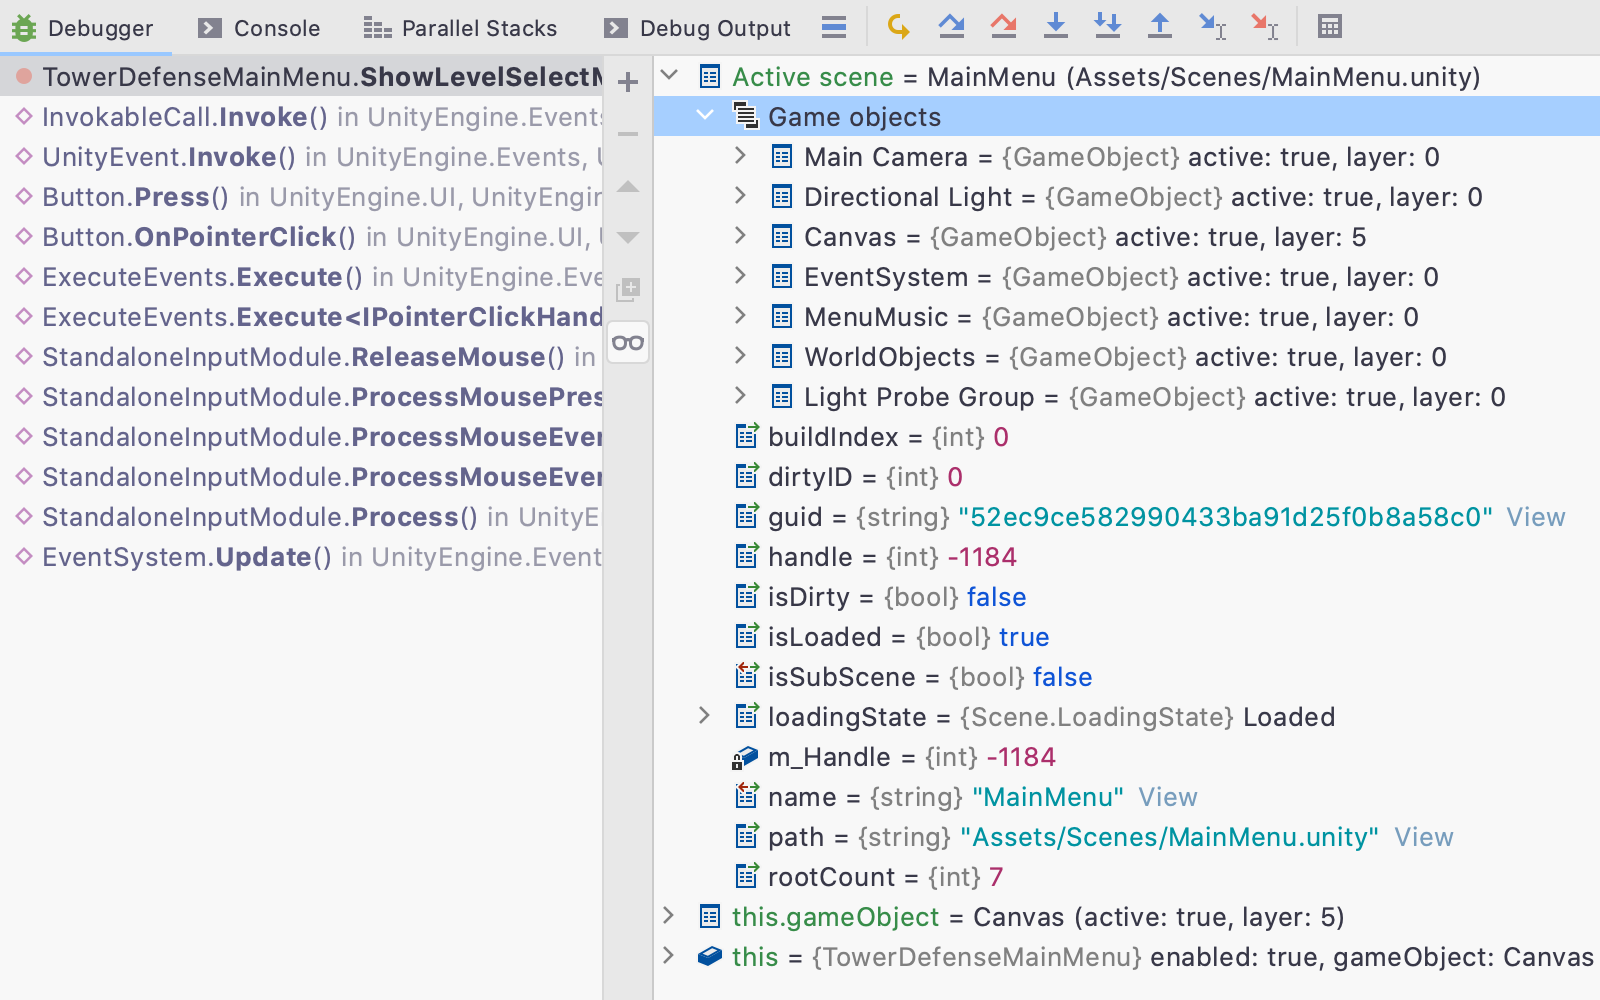
Rider does this in a number of ways. It will add extra items to the Watches and Variables tab, showing you the currently active scene, for example. It also adds extra child items to expanded values – the "Active Scene" item will show root game objects, and each GameObject shows child game objects and attached components, giving a view of the whole scene hierarchy. Rider has also updated the summary information displayed for some Unity types, pulling useful information up so it’s always visible, such as showing the position, rotation and scale of a Transform without having to expand the value. Let’s take a look at more details, and see some examples.
Active scene and the game object hierarchy
Whenever you hit a breakpoint, Rider will add an “Active Scene” item to the Variables and Watches tab, very much like an automatically created watch variable. This shows the active Scene object, as returned by SceneManager.GetActiveScene. The idea here is to give you the context you need for your Unity game, and the active scene is a great entry point for this. Collapsed, it will show the scene name and file path, and when expanded, you’ll not only see the normal debugger view of fields and properties, but you’ll also see a new group called “Game objects”. Expanding this item will list the root game objects in the scene.
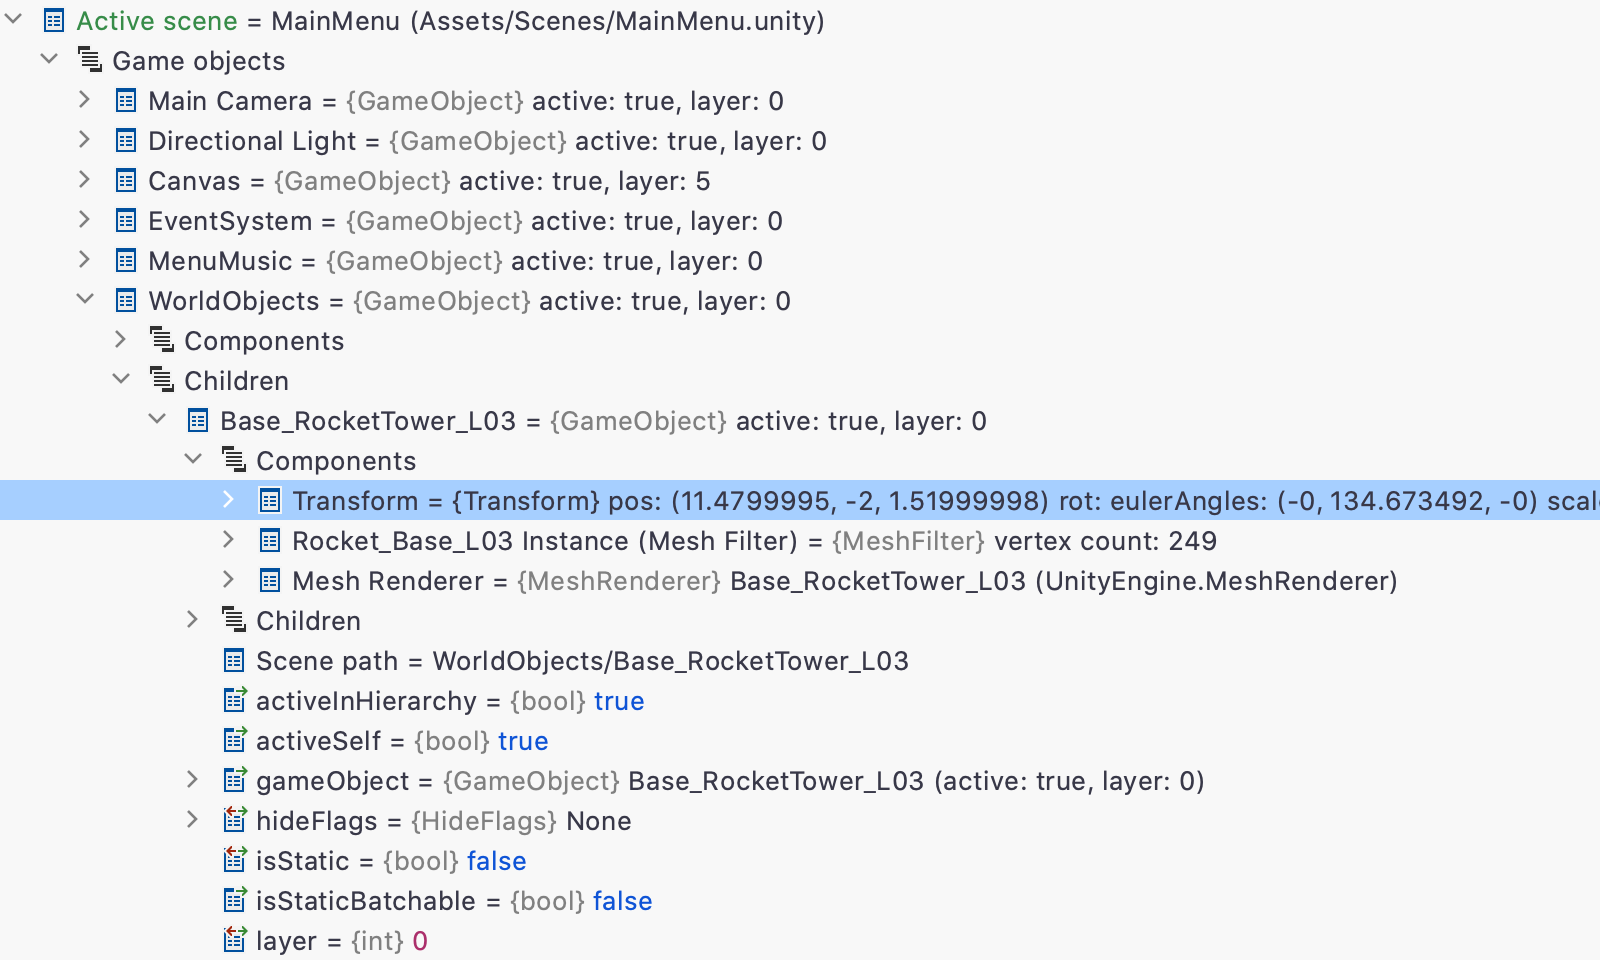
Rider adds new items to GameObject instances, too. The “Children” group shows the child GameObjects of this instance, very much like how the “Game objects” group works for Scene. You can use this to get a debugger view of the entire object hierarchy of your scene. And don’t worry about performance – Rider collects these values on demand, so they’re not calculated unless they’re shown, and Rider will group results larger than one hundred game objects, so it will handle very large hierarchies, too.
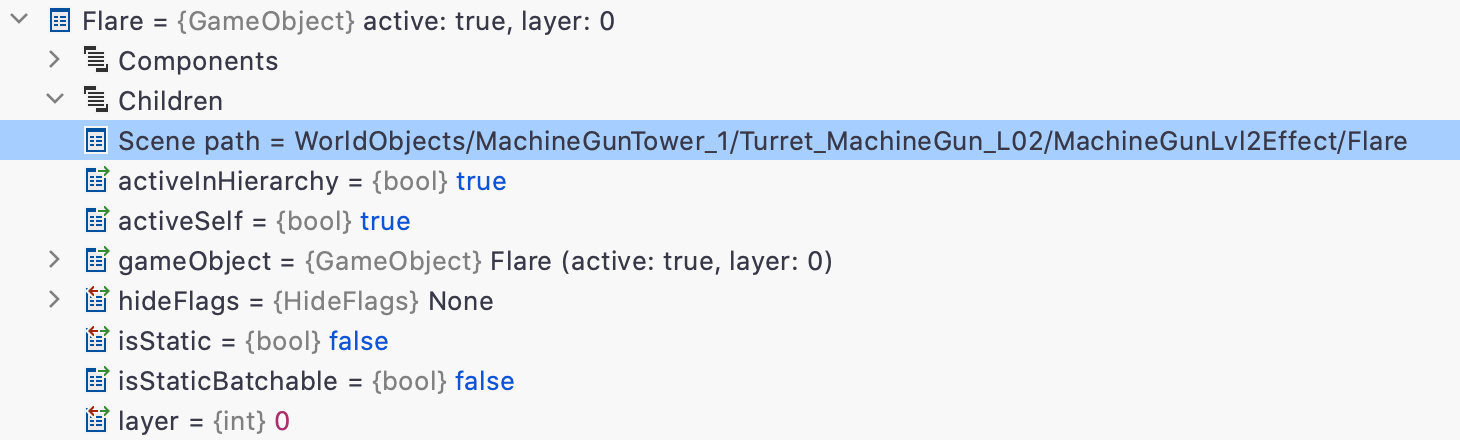
You might notice a couple of other new values under GameObject. There’s a new “Components” group that shows all Component instances attached to the GameObject, such as Transform or any attached MonoBehaviour derived scripts. And there’s a new “Scene path” value that shows the location of the GameObject in the object hierarchy, as a path from the root object. This is also shown for Component instances, making it a little easier to see where a GameObject or Component is being used in the object hierarchy.
Finally, if the current object being debugged – i.e. this – is a Component such as a MonoBehaviour script, then Rider will add another “automatic watch variable”, this.gameObject. This does exactly what the name implies and shows the this.gameObject property. It would be very easy to expand this and find the gameObject value, but this simple addition pulls some useful context up to the top level to make it quicker and easier to find.
Improving summary info
So far, we’ve looked at only one way the debugger has to display values – the Variables and Watches tree view. This can show complex objects such as a class or struct by expanding the value to show fields and properties. But when collapsed, the debugger shows a brief summary, hopefully showing the most relevant information. You can also see this summary info in tooltips, and drawn on the editor surface.
This content comes from the object itself, either as the output of ToString() (which by default is simply the name of the object’s type, but can be overridden in derived objects), or from the [DebuggerDisplay(...)] attribute, which specifies field or property names in a string.
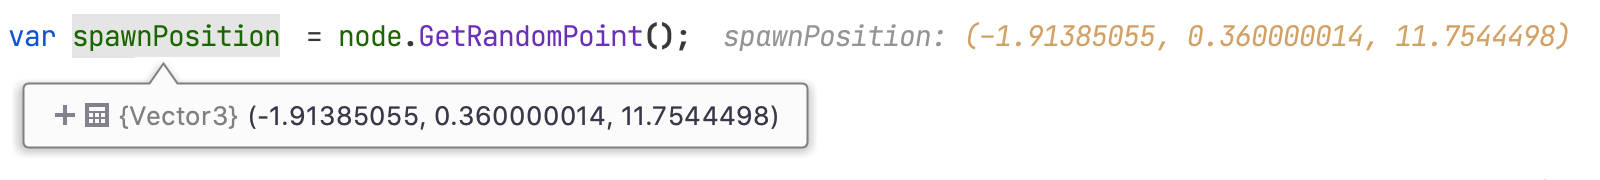
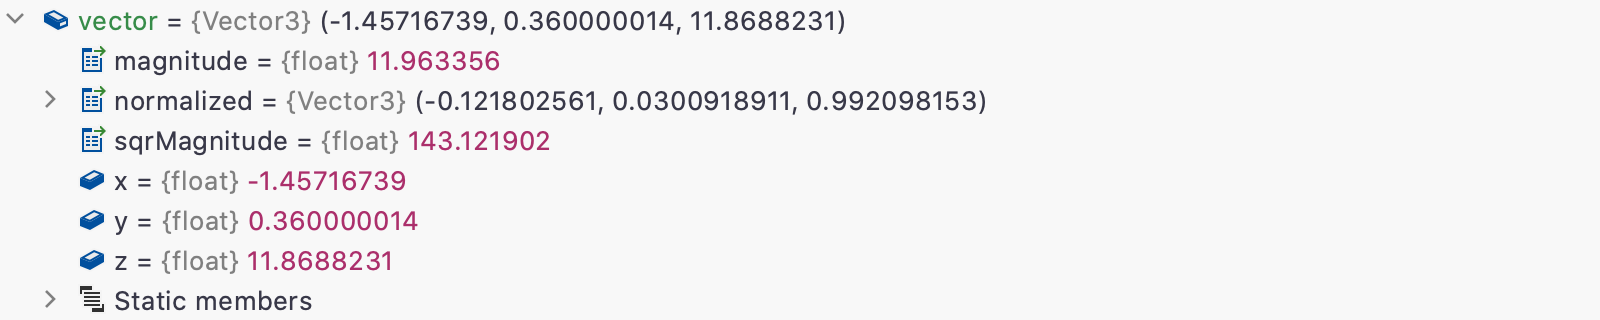
Unity doesn’t make much use of [DebuggerDisplay], but it does override ToString() in a number of places. Unfortunately, the output of ToString() is sometimes more appropriate to user facing output than it is to debugging. For example, the implementation of Vector3.ToString() defaults to showing the float values of x, y and z with the F1 format specifier. This means that each float value is shown to one decimal place. While this makes for a nice looking output, it’s not helpful when the summary and expanded view of an object are so different.
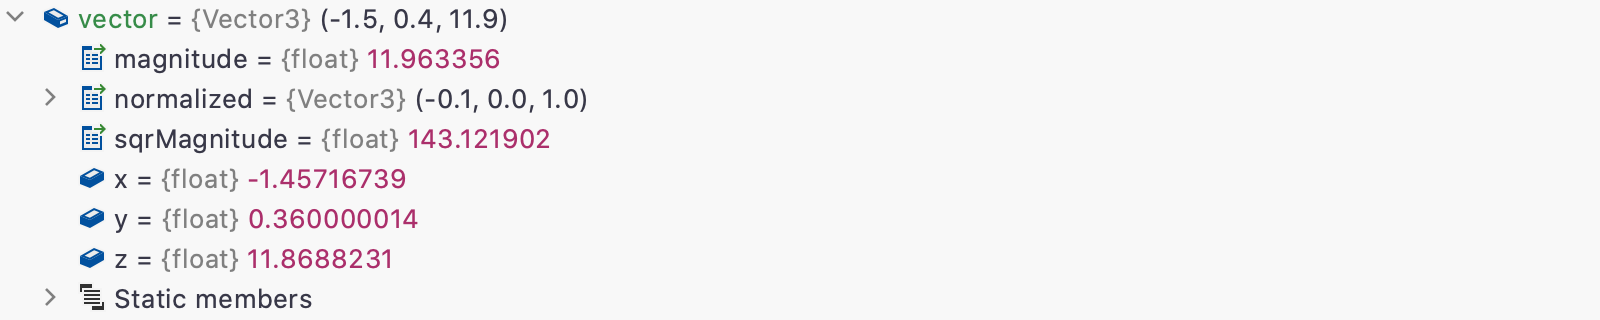
So Rider provides alternative summary information for a number of Unity types. This includes the Vector types, as well as Rect, Bounds, Plane, Ray and so on. Any Unity type that outputs float values at F1 has been overridden to show the field values at full precision, making it much easier to see, at a glance, what the value actually is.
There are other types that Rider overrides like this. Transform is a great example. Transform derives from UnityEngine.Object, which provides an implementation of ToString that shows the name of the object and its type. The name of a component is always the name of the game object it’s attached to, so for a transform, this quite often shows something like "Cube (UnityEngine.Transform)". Wouldn’t it be better to show the local position, rotation and scale without having to expand the object?

Rider provides overrides for a few other Object based types – the MeshFilter component quickly shows the vertex count and Scene will show the scene name and file path. GameObject shows its name and the activeInHierarchy and layer properties. Objects deriving from Behaviour show the enabled flag, plus the name of the GameObject they’re attached to, surfacing the most important details to tooltips and summary information.

And don’t forget that you can add debugging information for you own types too – override ToString() or use [DebuggerDisplay(...)] to provide summary information, or use [DebuggerTypeProxy(typeof(...))] to specify an object to provide different fields and properties when you expand an object. And the [DebuggerBrowsable(...)] attribute can be used to hide a type member. See the docs for more information.
Round up
Of course, many of Rider’s other debugger features work just fine with Unity projects, too. Things like Pin to Top and setting the next statement, conditional and dependent breakpoints (these work great with pausepoints, too!), debugging decompiled code, and also the new Pin to Frame (although sadly, not the Data Breakpoints in that blog post, as that requires an API that is only available in .NET Core on Windows).
And finally, the best kind of new feature – we’ve removed something! Both GameObject and Component have a number of obsolete properties that do nothing but throw exceptions. They’re hidden from code completion with the [EditorBrowsable(EditorBrowsableState.Never)] attribute, but not hidden from the debugger with [DebuggerBrowsable(DebuggerBrowsableState.Never)]. You might have seen this in older versions of Rider – the exceptions aren’t causing any problems, but they do add a lot of noise. Rider now filters them out. Much cleaner!
Before we finish, it’s important to point out that all of these features are available when debugging your game in the editor, but not everything is available when debugging players. This is because the debugger can’t always get the information – some features require APIs that only exist when the application is running in the Unity editor, and others require fields or properties that are stripped from player builds. If it can get the data, the debugger will show it. If not, it will gracefully fall back, and you’ll see the standard ToString representation of the value.
Oh, and if you don’t want to see this extra information, you can disable it in the Preferences | Languages & Frameworks | Unity Engine settings page.
In the next few posts on Unity, we’ll take a look at analysis of Burst enabled code, the long awaited shader support, and perhaps we’ll have a quick round up of other changes. In the mean time, download Rider and try out the updated debugger on your own projects. We’re looking forward to your feedback!
↧
Webinar – Xamarin, MAUI and the reactive MVVM between them
Join us Thursday, September 17, 2020, 16:00 – 17:00 CEST (10:00 AM – 11:00 AM EDT or check other timezones) for our free live webinar, Xamarin, MAUI and the reactive MVVM between them, with Rodney Littles, II.
Register now and get a reminder, or join on YouTube
Xamarin Forms is the .NET cross platform technology that allows you to write an application in C# and target various operating systems, primarily mobile. The recommended architectural approach for .NET applications adhering to SOLID principles is Model-View-ViewModel (MVVM). ReactiveUI is a MVVM framework based on Reactive Extensions, which are a cross language approach to functional programming. During this talk we will take a trip through Xamarin, MVVM, ReactiveUI and show the future state of Xamarin, MAUI.
↧
↧
Say Hello To Localization Manager In Rider 2020.2
Hello friends, or should we say こんにちは (Kon’nichiwa)? We have some excellent news for our multilingual Rider developers. Localization Manager, which previously appeared in ReSharper, is now available to all Rider users. We can build multi-cultural .NET applications, with the localizable resources using the new feature.
To get started with the Localization Manager, we first need to add a resource file. In this post, we’ll be using a Greetings.resx file along with a Greetings.ja-jp.resx to hold our Japanese translations.
To open the resource editor, we can use Go to Action (Ctrl+Shift+A) and search for "Localization Manager." Once open, we can see the layout. On the left-hand pane, we can see our project along with all of our resource files and their target culture. On the right-hand side, is our editor pane. In the editor pane, we can add new resources, edit existing ones, and see cultural values side by side.

Adding Resources using Localization Manager
We’ll start by adding a new localized resource to use in our code.

Great! We’ve added our first localized value using the localization manager editor.
Adding Resources from the Text Editor
Like other features in Rider, many of the same GUI actions can be performed via quick-fixes and suggestions directly from our code. When adding a string literal to our code, Rider will suggest localizing the value by adding it to our resource file.

We can use the context action to move the string literal into a resource for quick and efficient operation.

Quick actions also allow us to open the editor window from any existing resource found in our code. With the cursor over our resource string, we can invoke the action Edit with Localization Manager to open the tool window and highlight the current value.

Adding a Culture using the Localization Manager
Translations are like potato chips (or crisps if you’re British) – you can’t just have one. We can add more cultures from the editor window using the "+" icon located in the left-hand pane’s toolbar. Thankfully, Maarten is a native Belgian and agreed to help me translate my app.

Note how we got code completion for various culture codes, and how a new resource file Labels.de-BE.resx was created.
Filtering Resources
The localization manager will help us manage our resource files, cultures, and localized values. Using the editor, We can use the filters and search to scope the editor grid to the cultures we are working with. This is especially useful as we begin to handle more cultures.

Import/Export Localized Values
Commonly, we need to lean on professional translators to get the nuances and idioms of a language correct. Translators work with tools like Google Sheets and Microsoft Excel to edit spreadsheets and are unlikely to be using a tool like Rider. Luckily for us, Rider supports importing and exporting localized values into a CSV format.

Spotting Missing Translations
From within the Localization Manager tool window, we can easily spot missing translations for localized values as the cell is highlighted with a different color.

We can also use the editor toolbar to filter to missing values, show comments, and navigate to resource files.
When editing a .resx file, we can see the resource topology and whether the value is overriding a parent resource value.

Spotting Unused Resources
When Solution-Wide Analysis (SWA) is enabled, the Localization Manager will scan our entire solution for usages of resources. Resources that are in use are rendered in bold, while unused resources are not.

Knowing what resources are being utilized helps us clean up resources we may no longer require. Knowing whether a resource is used is also useful for our next feature.
Refactoring Resources: Rename and Safe Delete
Adding resources can be simple, especially when using the Localization Manager. Removing and refactoring can cause breakage and hours of lost productivity… If you aren’t using Rider, that is.
The localization features in Rider allow us to Safe Delete resources. Rider will verify a resource can be deleted without breaking our existing code using the same analysis tools we all know and love.

We can also refactor resources from the editor, either from inside a resource file or from our code, by either using the Rename/Delete refactorings directly or using Refactor This… (Ctrl+Shift+R).

Note that we can also move and inline resources from here.
Conclusion
Software is about changing people’s lives, and with the Localization Manager, we can reach more folks. As always, thank you for reading. ありがとうございました (Arigatōgozaimashita).
Download Rider 2020.2 now! We hope you give it a try, and we would love to hear what you think about the new Localization manager!
↧
The Rider 2020.2.1 and ReSharper 2020.2.1 Hotfixes Are Here!
We’ve just published two hotfix updates, Rider 2020.2.1 and ReSharper 2020.2.1. Here are the highlights of what we’ve introduced. For the full list of changes, please refer to our bug tracker.
Rider 2020.2.1
NuGet
- We’ve fixed the bug that caused all NuGet packages to be restored unnecessarily before building the project (RIDER-49125).
Unit testing
- NUnit2 tests are no longer left in an Inconclusive state with System.NullReferenceException (RSRP-480840).
- The option to run NUnit tests from a specified folder now works correctly (RIDER-49367).
- The appsettings.json file is read correctly when running xUnit tests (RIDER-49177).
- The Environment.CurrentDirectory setting for NUnit tests has been set to ‘Test assembly’s folder’ by default.
- A variety of other requests has been fixed – please refer to this bug tracker query for more information.
Unity
- Resolving INTERNAL_DATA macros and related functions has been improved (RIDER-48368).
- The behavior of the setting for suppressing errors in shaders has been updated: it now hides all resolve problems (RIDER-49123).
- We’ve also turned off errors from .shader files in the ‘Errors In Solution’ view.
ReSharper 2020.2.1
- We’ve eliminated the freeze on bulk operations, such as Remove unused references (RSRP-480776).
- A set of bug fixes in unit testing described above in Rider’s section.
At the moment we’re still investigating a list of issues in unit testing. We’re grateful for your feedback, and if there’re any other problems you’d like to let us know about, please feel free to file a request in our bug tracker, leave a comment to this post, or contact ReSharper’s or Rider’s support team.
You’ll find Rider 2020.2.1 and ReSharper 2020.2.1 on our website, or you can update using the Toolbox App.
↧
Special Thanks to All JetBrains .NET and VS Tools 2020.2 EAP Participants
As you may know, our .NET and Visual Studio tools got a massive 2020.2 update just a few weeks ago – the ReSharper .NET tools, ReSharper C++ and Rider blogs have more details. Now our sights are set on the 2020.3 release due out at the end of this year. But before we get back to work on that, we have one more important thing to say.
We are deeply grateful to all participants of our 2020.2 Early Access Program. You helped us identify countless issues, usability glitches, and missing features. Thank you so much!
We’d like to share our special thanks with these fine folks who have been the most active, and present them a complimentary 1-year dotUltimate subscription. (Your YouTrack username is listed if we do not know your full name):
- ReSharper .NET Tools EAP:
- Lucas Trzesniewski
- NN __
- R H (Robert Heuvel)
- Kirill Rakhman
- ReSharper C++ EAP:
- 润聪 李
- Ruslan Khamidullin
- Rider EAP:
- Christian Andersen
- Marcel Wiessler
- darth pixel
- Oliver Ehrenmüller
We’ll email each of you in the next few days with a coupon code that can be redeemed to get a new subscription or extend your existing one. If you’d like to pass that code to a friend or colleague, that’s OK, too. Thanks again!
Your .NET team
JetBrains
The Drive to Develop
↧
Improved Analysis and Hints for Nullable Reference Types
If you are already using nullable reference types, you might have noticed that they can help make your code safer. But not automagically… This feature relies heavily on everything called by your code being annotated.
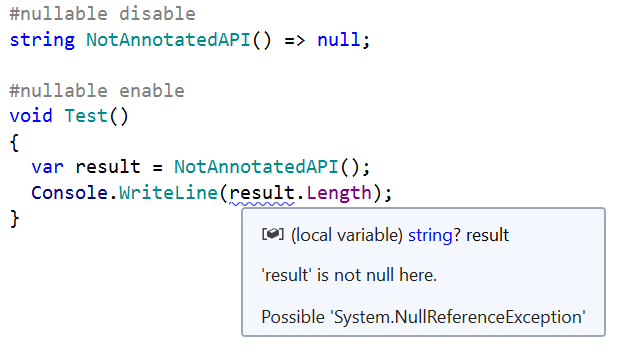
Unannotated APIs are a big problem for nullable reference types, as they never produce warnings. Values from such calls show extremely optimistic non-null hints, even though there are no guarantees that these hints are correct. Here’s a compiler issue for this problem.
For example, if you are using LINQ’s FirstOrDefault() method from .NET Core 3.1, the compiler not only allows you to dereference its result without any warnings, it also tells you that it is not nullable – something we all know might not be true:
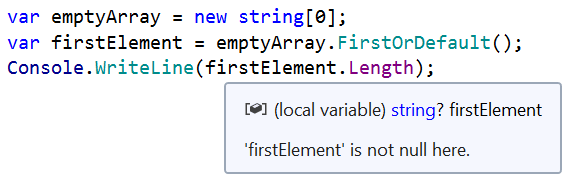
The framework API is being annotated right now and the above won’t be a problem if you can use the .NET 5 preview, or migrate to it as soon as it reaches RTM.
However, there are lots of unannotated libraries and large projects that cannot be annotated in a timely manner. They represent a big problem for the nullable type system and the safety net it provides.
Some of these codebases might already have nullability information available in the form of JetBrains.Annotations, but these, unfortunately, cannot be utilized by the compiler.
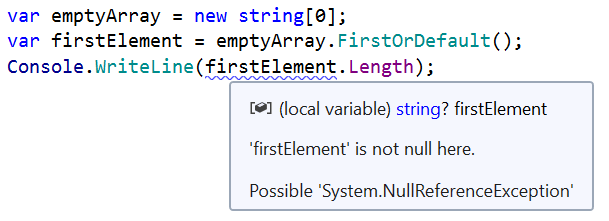
Luckily, ReSharper (and Rider) warnings don’t have such limitations, so now both will take these into account as well when nullable reference types are enabled. Of course, it will also use external annotations to fix the FirstOrDefault example above even when it isn’t annotated, e.g. in .NET Core 3.1:
You can also make use of ReSharper’s pessimistic analysis mode (Code Inspection | Settings | Value analysis mode in the ReSharper options) to tell it that you want a bit of extra safety with unannotated APIs, in which case it will tell you to check any value that wasn’t explicitly declared safe to use (i.e. any values that don’t have any annotation at all). Use this with caution, however, as it comes with lots of warnings!
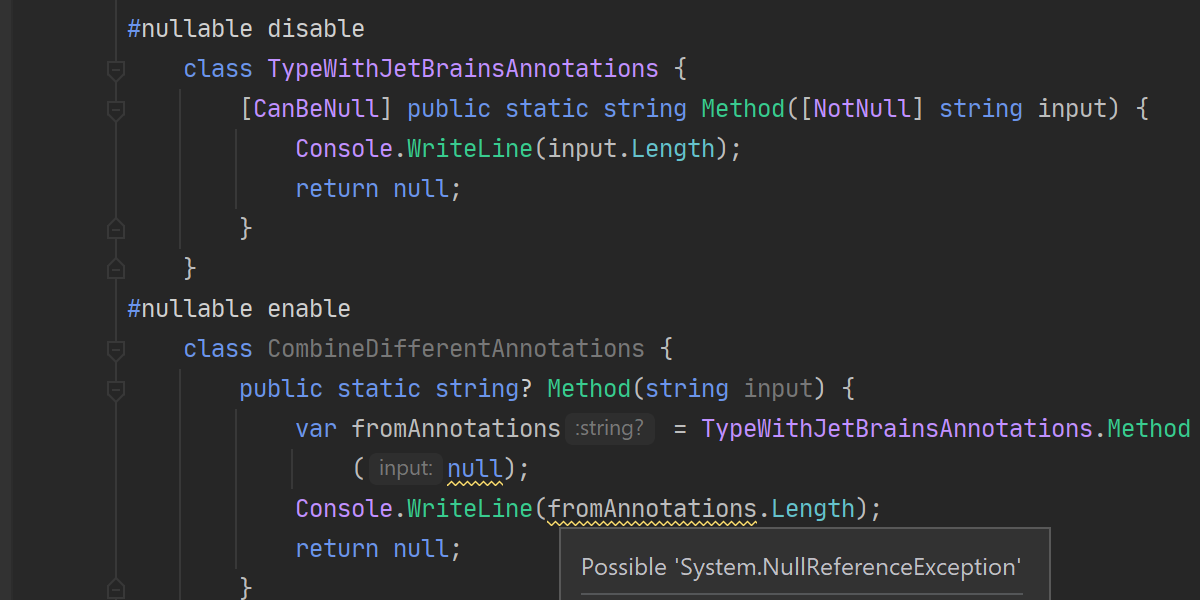
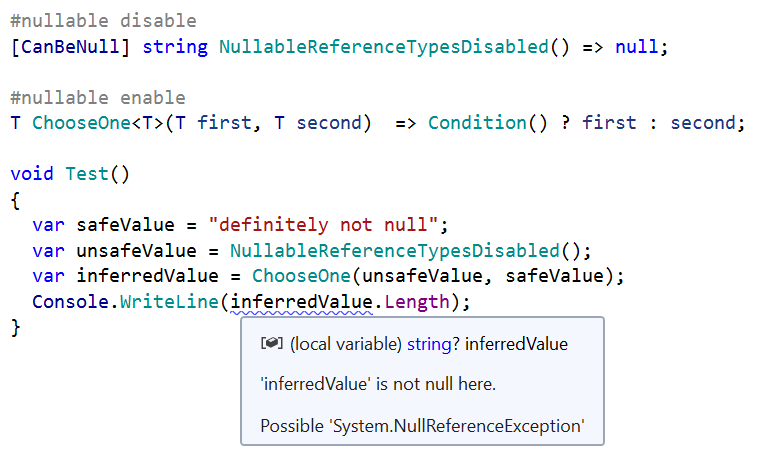
Showing these warnings has been made possible by extending the allowed states of variables in the analysis with new values representing a value without proper annotations, e.g. coming from a code without #nullable context. Such a value might be annotated with either [NotNull] or [CanBeNull] attributes, or its nullability might be completely unknown.
This implementation has some notable implications. First, since these additional states are part of the nullable analysis, they are tracked at no additional performance cost and do not require a separate analysis pass over the code.
Second, these states are fully integrated in the analysis and take full advantage of the language type system, for example they are utilized by type inference:
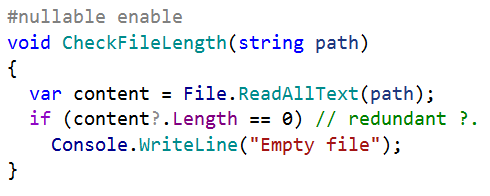
Finally, as unannotated and non-nullable states are now decoupled, we can tell you when some values are truly not nullable without the risk of misinforming you due to unannotated calls.
For example, code analysis can now tell you if a null check or conditional access is redundant:
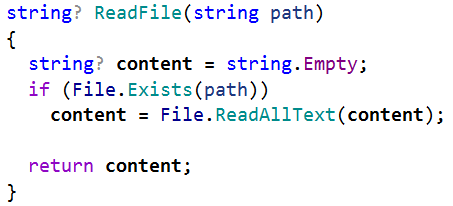
Or it can tell you that a method never returns null values and so its contract can be stricter. The same is true for local variables where ReSharper and Rider can tell you when a nullable variable is never used as such, and can be declared as non-nullable.
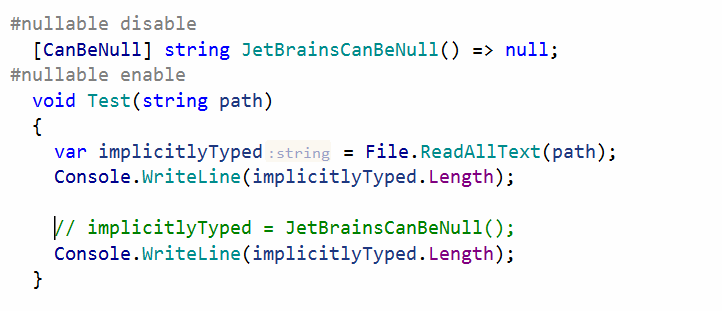
In the following example, ReSharper recognizes that the content variable will never hold a null value (even though it’s declared as nullable), and that the ReadAllText() method can not return null. As a result, nullable annotations can be safely removed for both the variable and the method’s return type:
This opens up an interesting opportunity to improve type hints. As you may already know, implicitly typed variables are now nullable by default, which means they can be reassigned with nullable values regardless of whether they were originally initialized with a nullable or non-nullable value. You can check the following language design notes explaining the motivation behind this change.
Calling attention to this fact via type hints turned out to be confusing for lots of people. They could initialize a variable with a non-nullable value and use it safely without ever reassigning it, yet as the variable was technically nullable and displayed a nullable type hint, it was perceived as not safe to use.
Now, ReSharper and Rider recognize variables that are always safe to use and don’t ever hold any nullable or even unknown values. Starting from 2020.2, ReSharper and Rider will work their magic and provide you with this information by identifying such variables as non-nullable through type hints:
Conclusion
In this post, we have seen that APIs that do not yet use nullable reference types may lead to incorrect code analysis, thus compromising null safety. ReSharper and Rider recognize such APIs and uses JetBrains.Annotations, if available, to ensure null safety.
ReSharper can also be switched to pessimistic analysis mode for extra safety when working with APIs that do not have JetBrains.Annotations. As misleading information from unannotated APIs is no longer a problem for ReSharper, it can now provide redundancy inspections for null checks and nullable annotations, making it possible to tighten nullability contracts. Type hints now indicate whether a variable ever contains a null value, making it clear whether you can always use it safely.
What do you think? Download ReSharper 2020.2 or Rider 2020.2, and give it a try!
↧
↧
.NET Annotated Monthly | August 2020
Summer is here, but at present in 2020 many people can’t go anywhere, so a "staycation" will have to do. No problem though, just sit back, relax, and browse the content from our .NET Annotated newsletter.
There have been some key historical events that have happened in August. In 1995, Microsoft shipped Windows 95! Windows 95 was the "moment you’ve all been waiting for". I remember uncovering that Windows 95 Easter Egg with great delight! In 1981, IBM introduced its personal computer, IBM model 5150. When Windows 95 shipped, many folks were using IBM personal computers to run it.
↧
Debugging Unity Players over network and USB with Rider 2020.2
Rider 2020.2 is a bumper release for Unity. We’ve already seen how “pausepoints” can help you debug your code, by switching the Unity editor into pause mode when your code hits a certain point. Let’s continue looking at how Rider can help with your Unity application.
We’ll stick with debugging for now, and in this post we’ll see how you can use Rider to debug your game on mobile devices and consoles such as iPhone, Android, Xbox and PlayStation.
We’ll follow up with another post looking at how Rider improves the default display of values while debugging, and then we’ll have a couple more posts detailing Rider’s Burst analysis, and then take a dive into, wait for it, shader support!
Rider has always supported debugging players, such as standalone desktop apps, mobile devices and consoles, but this release sees a number of new features, a bit of polish and a couple of bug fixes to make it even better. It also introduces USB debugging for Apple devices.
Player discovery
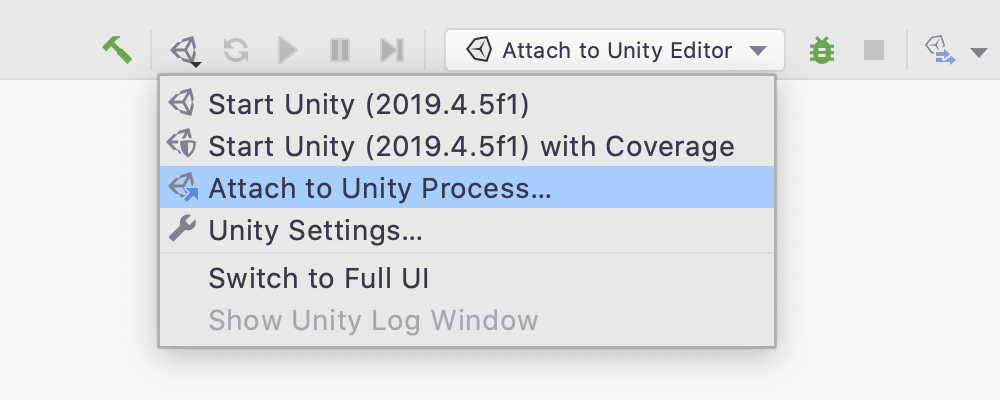
It’s nice and easy to start debugging a player, simply use the Attach to Unity Process action, available in the Run menu, or in the drop down menu when you click the Unity logo in the main toolbar.
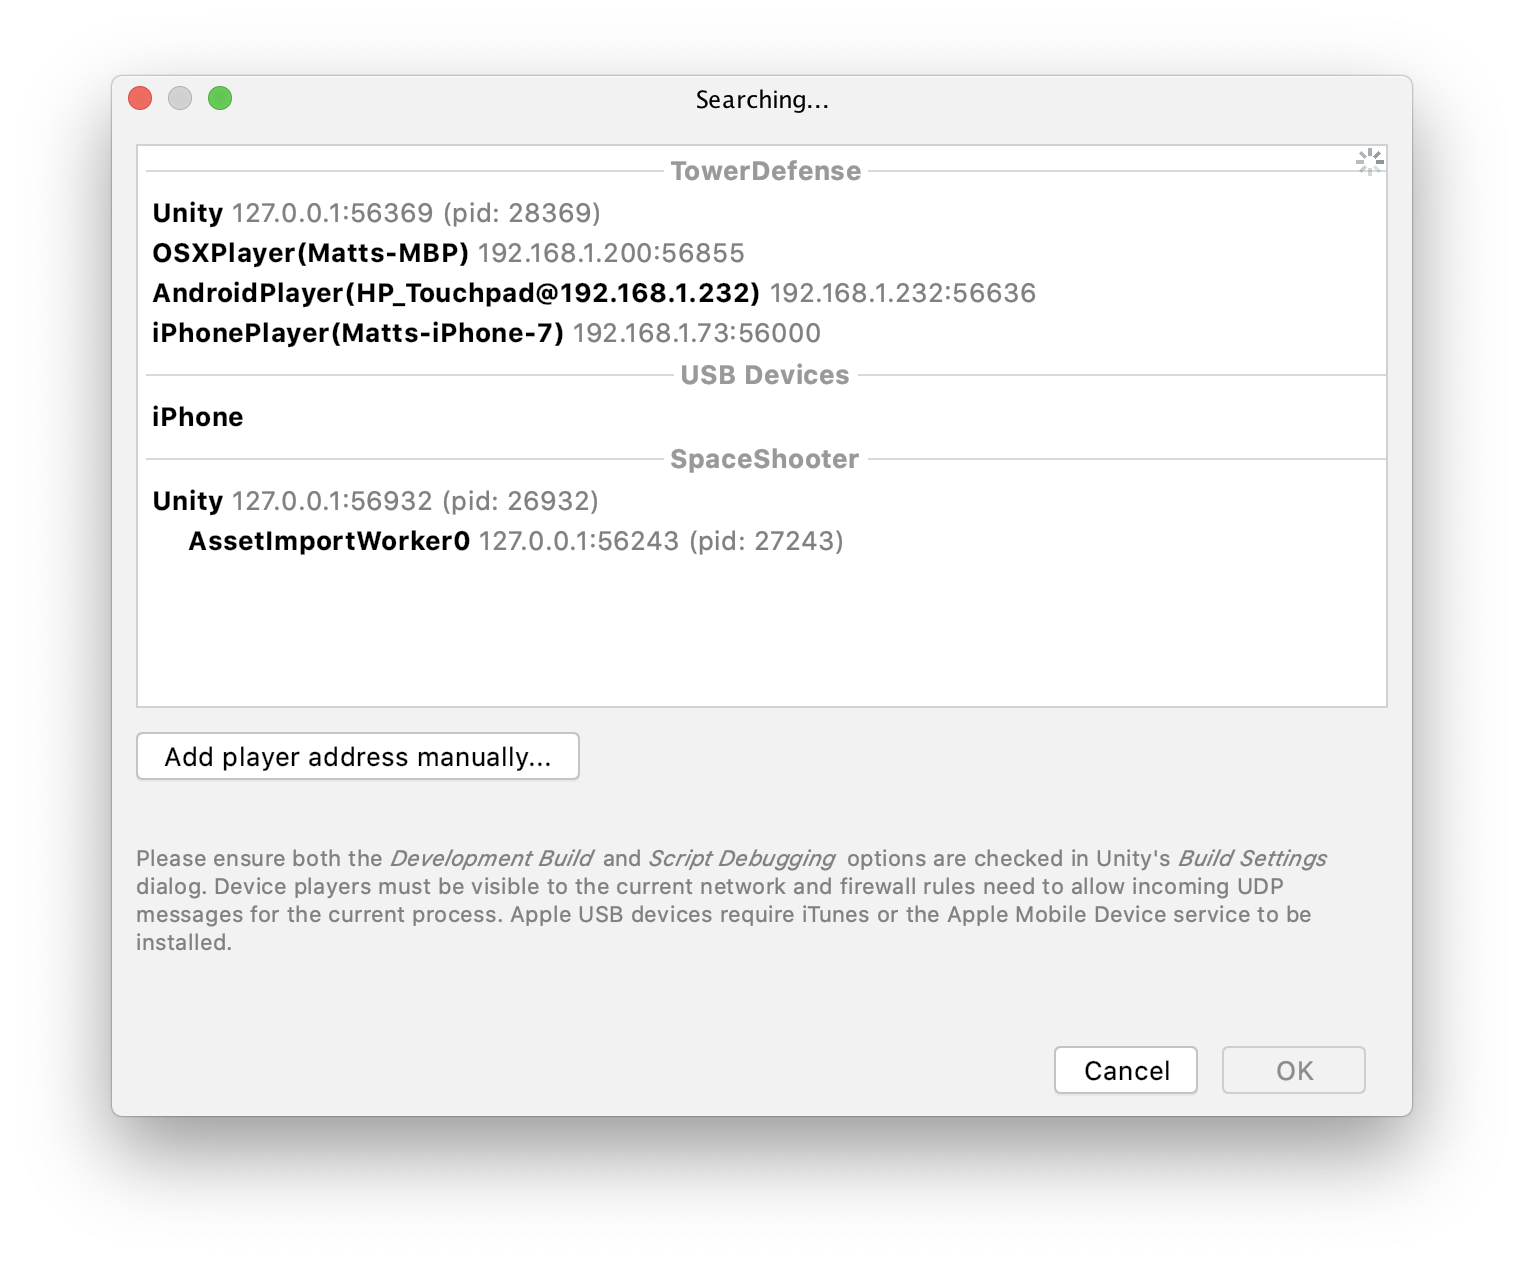
This will open the Attach to Unity Process dialog, which lists the available processes to debug. This dialog has had a little polish in this release, and now groups the players by project, with the currently open project at the top of the list.
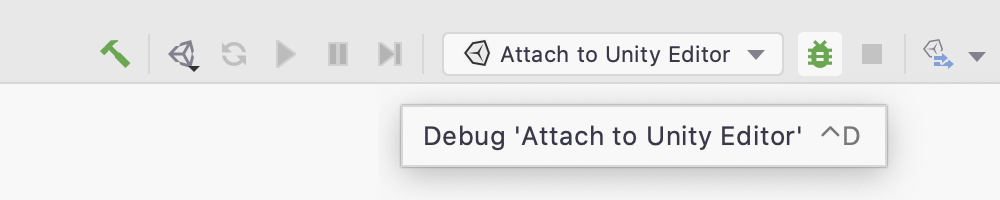
Looking back at the screenshot of the dialog, you can see that there can be quite a few different processes listed. Let’s take a look at what Rider is going to show you. Rider will list all editor processes, grouped by project when possible, with the current project shown at the top of the list. You can attach the debugger to the editor from this dialog, or you can use the Attach to Unity Editor run configuration and just click the Debug button in the main toolbar.
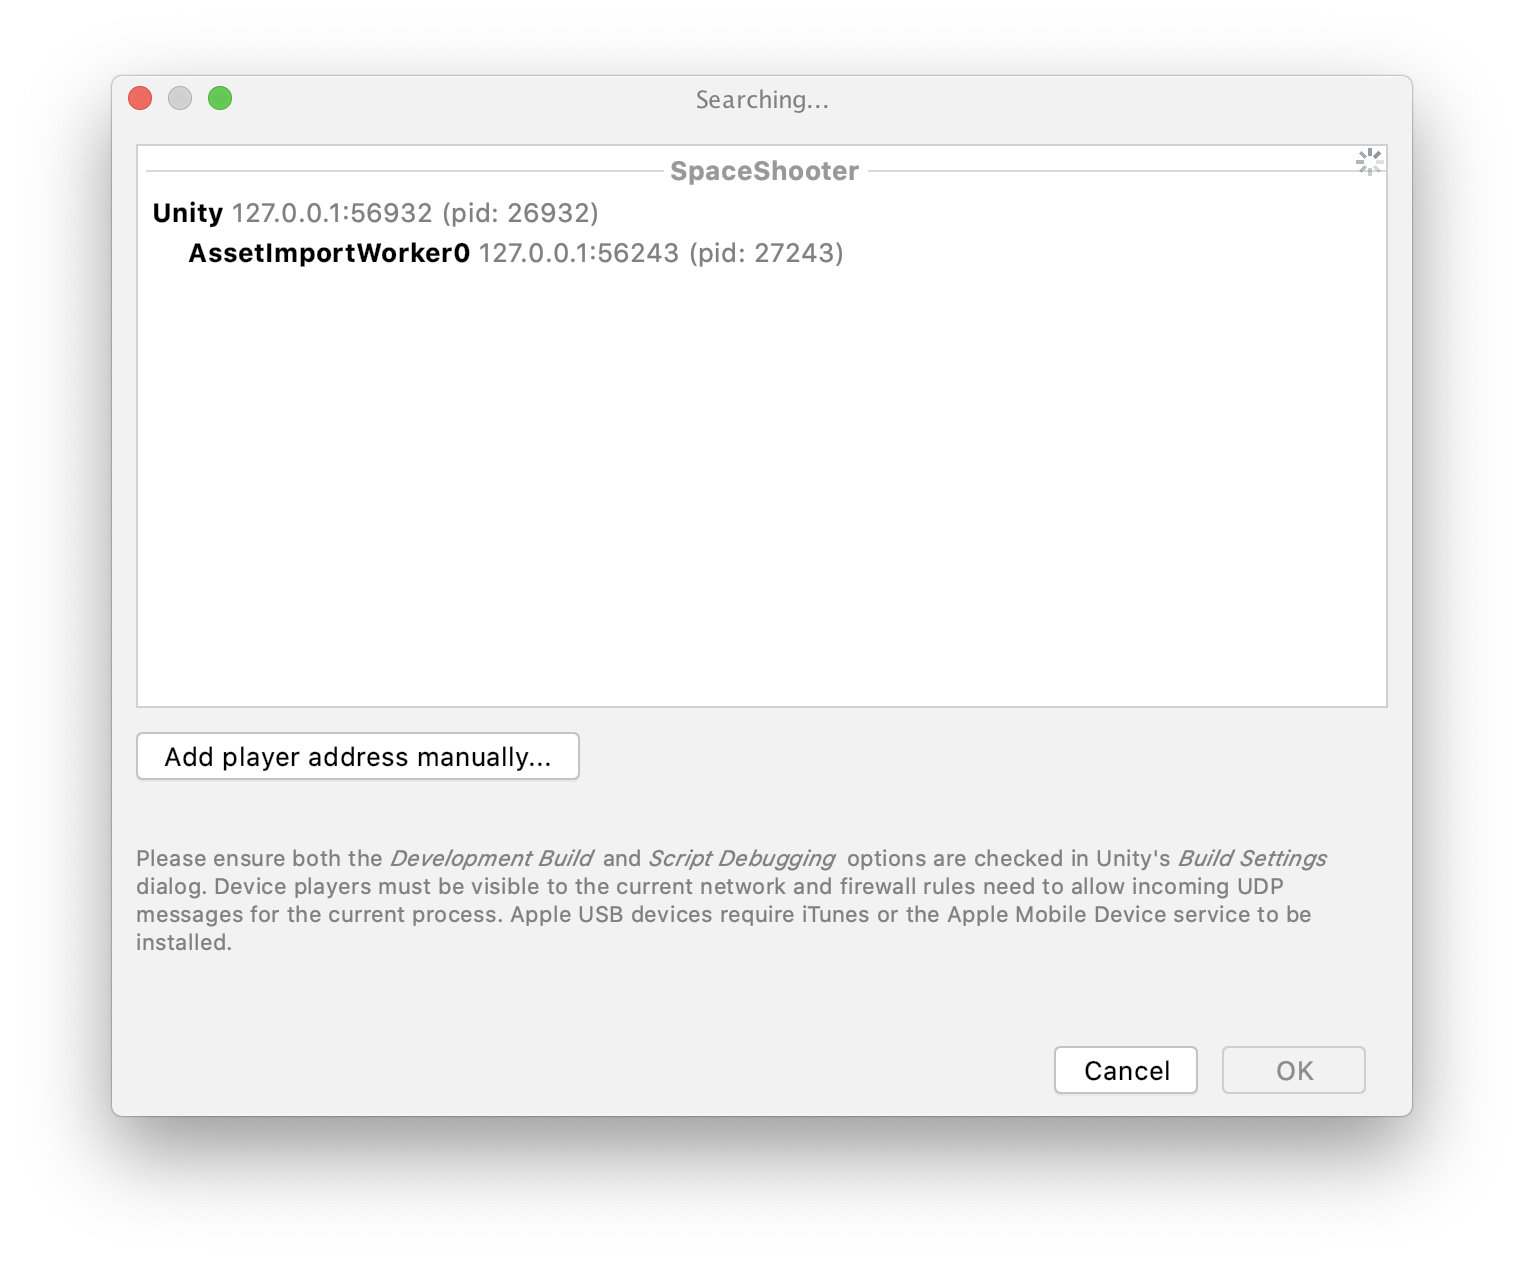
Rider will also list any helper processes created by the Unity editor, shown as a child of the main Unity editor process. This is useful for debugging features that Unity runs out of process, such as asset import workers for the new DOTS system.
Rider will then list all other players for the current project. This includes standalone players such as the Windows or OSX player, followed by remote players, such as mobile devices or consoles.
Selecting an item in the list and clicking OK will start the debugger (double-click the item if you’re in a hurry), and that’s it! You’re now debugging your game running on a device. Rider’s debugger features work just the same as if you’re debugging a local process – local variables, watch variables, evaluating expressions and calling methods and so on. And everything works great with cellular devices such as phones that can connect to the internet via WiFi or their own cellular radio.
Apple USB debugging
New to Rider 2020.2 is debugging of Apple devices over USB. You can now debug your iPhone or iPad game via network, or over a USB connection. This can be really useful if your device isn’t able to connect to the same network as your desktop, or if your local WiFi is being a little flaky, or simply as a preference.
It all works seamlessly – the connected iPhone or iPad is listed in the “USB Devices” group, and you can simply select or double click and you’ll start debugging, just the same as over the network.
Rider doesn’t have much information about the connected device, so it’s lised simply as iPhone or iPad. And Rider also doesn’t know what’s running on the device, so you won’t get a project name, and in fact, you’ll see the device in the list even if your Unity game isn’t running!
The obvious question now is “what about Android?”. Rider doesn’t currently support USB debugging for Android, but you can still debug your Android game over the network. We’re planning on adding Android USB debugging in Rider 2020.3.
Manual player discovery
If for some reason the player doesn’t show up in the list, and you can find the device IP and port number from the player logs, you can use the Add player address manually button to enter the custom network details and connect the debugger manually.
Debugging and profiling standalone players
One other thing that Rider 2020.2 will do is to create a new run configuration when you build a standalone player. Rider’s plugin for the Unity editor will spot that a standalone player, for Windows, Mac or Linux, has been created, and will automatically create a run configuration called simply “Standalone Player”.
Once the run configuration is selected, the Run button will launch the desktop player. The Debug button will launch the process and attach the debugger. And you can even use the Profile button to launch the process and attach the timeline profiler to get a code focused profile of your standalone player.
You can find out more about profiling Unity executables in this blog post from Rider 2019.1 when we first introduced the feature.
Requirements
Now for the small print!
On the whole, it’s very easy to build and debug players from your Unity project, but there are a couple of required steps to make sure things work smoothly. You can read the details in Unity’s documentation (see the Troubleshooting the debugger section), but the TL;DR is that firstly, the player build must have Script Debugging enabled. If it doesn’t, Rider will highlight this in the dialog, and you’ll be unable to attach to the player.
Secondly, you need to make sure that the remote device is visible to your desktop’s network, and that firewalls aren’t blocking any traffic. The players broadcast their debug details via UDP messages, and if there’s a firewall blocking this, the player won’t appear in the list.
Finally, the version of Unity that you use to build your player makes a difference, too. If your player is built with a Unity version earlier than 2019.3, then you won’t see a project name – only players built with Unity 2019.3 and above broadcast this information. Rider will still happily debug older players, but they will be grouped under “Unknown projects”.
And you’re not limited to the Mono backend either – Unity 2018.2 added support for debugging IL2CPP based players as a normal C# application, so Rider is able to debug Mono or IL2CPP players.
Download Rider 2020.2!
As you can see, Rider makes it easy to debug your Unity game. It’s very easy to attach to the Unity editor from the main toolbar, and the Attach to Unity Process dialog lists Unity editors, helper processes, local standalone players, remote players on devices and consoles and even Apple devices attached by USB. You can even launch, debug and profile standalone players with a single click!
Next time, we’ll take a look how Rider 2020.2 improves the default display of locals and variables in the watch window.
Download Rider 2020.2 EAP today, and try it with your own game. We’d love to hear your feedback!
↧
ReSharper 2020.2: Improved Code Analysis for C# 8, Code Cleanup on Save, and Revamped Unit Test Runner
Hello everyone,
Today we’re excited to give you ReSharper 2020.2! This major release introduces new inspections and quick-fixes for C# 8, most notably for nullable reference types, a much-awaited Code Cleanup on Save, a revamped Unit Test Runner, and various accessibility improvements.
Since the ReSharper license now covers both ReSharper and ReSharper C++, support for C++/CLI – a bridge between the languages – is getting a lot of updates and improved interoperability between C++/CLI and C#.
Read through the major updates of all the JetBrains .NET tools and extensions:
Also, visit our What’s New page for the full release notes.
ReSharper 2020.2
Code Analysis
C# 8 support has been improved with a number of new inspections and quick-fixes, most notably for nullable reference types. For instance, code analysis now takes into account JetBrains.Annotations attributes (both NotNull and CanBeNull) for API declared in code where nullable reference types are disabled (#nullable disable).
Also, nullability code analysis is now aware of more cases and can trace incorrect nullability through deconstruction and the foreach cycle. It also provides a corresponding quick-fix.
Code Cleanup on Save
Finally, you can set up ReSharper to launch Code Cleanup automatically on saving a file! We’ve also added more granular scopes to run Code Cleanup for recently modified or recently opened files.
Revamped Unit Test runner
We’ve remade our Unit Test runner from scratch for both .NET Framework and .NET Core, which allows us to use the same runner for both runtimes that run out of the Visual Studio process. This has helped us solve quite a lot of problems with discovering, running, and debugging unit tests, and gives us full control over unit test hierarchies for .NET Core tests. What’s more, the new test runner has built-in MSFakes support for the NUnit, xUnit, and MSTest v2 unit test frameworks.
In other news:
-
We have good news for UWP developers – support for compiled bindings with
x:Bindis finally here! -
This release comes with improved support for screen readers like JAWS, NVDA, and Microsoft Narrator.
-
Type and project dependency diagrams have been updated. The yFiles engine, which is used to draw the graph, has been updated to the latest version. This, in addition to our optimizations, means the resulting graph is drawn much faster. Also, you can export the graphs to new file formats, GraphML and XPS.
-
Navigating to usages of types from external assemblies in the code is now much easier. ReSharper can navigate directly from Go to Type search results to Find Usages.
-
New Peek actions have been added to show the result of some common ReSharper actions in a Peek Definition view.
- We have updated our offline and online installers to cover all products under the dotUltimate license, which includes ReSharper, ReSharper C++, JetBrains Rider, dotCover, dotTrace, dotMemory, and dotPeek.
ReSharper C++ 2020.2
Improved Unreal Engine features
ReSharper C++ 2020.2 introduces support for the Unreal Engine project model, which brings smarter auto-import for include directives and support for different solution configurations. To match the Unreal Engine coding standard, we’ve also included several updates to inspection severities and code generation actions.
Better C++/CLI support
We’ve updated C++/CLI support to improve interoperability with C# code, and we’ve added a set of code inspections for the sealed, gcnew, and safe_cast usages. Upgraded search and navigation features now work on imported CLR entities and allow you to look for derived symbols in C# code.
See the ReSharper C++ 2020.2 blog post for more details.
Command Line Tools 2020.2
- ReSharper command line tools now run .NET Core on Windows, Linux, and macOS, and you can install them as .NET Core Global Tools.
- dotTrace, dotCover, and dotMemory command-line tools for Linux (Debian and Ubuntu) can perform analysis on ARM64 systems.
- In the dotCover console runner, the
--reportype=SummaryXmlparameter lets you create a new Summary report type, which includes data on how many classes, methods, and statements are covered in total. Now, the runner can generate reports of several types at once. - The dotTrace console profiler lets you control the profiling session (take snapshots, detach from the profiled process, and so on) by sending commands to stdin or to a file.
- The dotMemory command-line profiler is now also available on Linux and macOS, in addition to Windows.
dotTrace 2020.2
Both standalone dotTrace and dotTrace in Rider can profile the native part of Mono/Unity applications on Windows. Start a session with the ‘Enable native profiling’ option selected, and you’ll see both native and managed call stacks in the performance snapshots.
dotPeek 2020.2
- Improved NuGet support: NuGet v3 package feeds are now supported in Open from NuGet, Open from NuGet packages cache, and Open NuGet packages.config.
- The new release brings support for the most recent version of C#, including the following language features:
- Expression-bodied members
Throwexpressions- Default parameters and named arguments
NullablePublicOnlyattribute
See the full list of fixes completed in the 2020.2 release cycle on YouTrack.
Visit our What’s New in ReSharper page for the full list of improvements. Let us know what you think of this release and please share your feedback here in the comments, in our issue tracker, or on Twitter!
You can use any of these alternative ways to get ReSharper 2020.2:
- Download and install from www.jetbrains.com.
- Update right inside ReSharper: ReSharper | Help | Check for updates.
- Use our Toolbox App.
↧
Rider 2020.2: Localization Manager, Debugger Updates, and Major Updates to Unity Support
Rider 2020.2 is now available! To mark this great news we’ve put together a full list of the new features and under the hood improvements that are in store for you. Let’s dive in!
Debugger
The new release brings significant changes to the debugger API. They allow us to perform super-lazy value calculations with better interruption and custom value representation. We’ve also added data breakpoints.
Finally, the Pin to Frame feature lets you pin local variables to the frame.
Localization Manager
We’re proud to introduce a new tool for working with resources. With the Localization Manager, you can view the content of any specified set of .resx files in your project, including all of them at once, in a single grid.
The Localization Manager allows you to easily perform the whole set of operations on resources: add, edit, rename, safely delete, find unused, find the resources missing localized values, find usages, export to and import from CSV, and add comments.
Unity
Unity support has received a major boost. Cg and HLSL shaders are now supported in syntax highlighting, code completion, navigation (including macros), refactorings, and more.
Pausepoints, which pause the Unity Editor when the debugger hits them, are now available. Rider now works with the Burst compiler, which means it highlights code that doesn’t match Burst constraints. For the whole list of improvements, check out this list.
VCS support
The main attraction here is the enhanced support for GitHub pull requests, which includes browsing, assigning, and merging pull requests, as well as submitting comments and reviews, accepting changes, and more. For more details, please check out this blog post.
Additionally, Git in WSL 2 is now supported, Compare branches are presented more conveniently, and you can squash commits selected in the Log tab of the Git tool window.
Unit testing
Our unit test runner has been rebuilt from scratch for both .NET Framework and .NET Core. This has helped us solve a lot of known problems with discovering, running, and debugging unit tests. The new runner includes built-in support for MSFakes for NUnit, xUnit and MSTest v2, along with the ability to run MSTest v2 tests without Visual Studio installed. There are also UI improvements for better presentation and filtering.
NuGet
The NuGet tool window has received a considerable feature boost. It now displays a solution’s transitive packages, provides a context menu with all the relevant actions for a single package, and indicates invalid feeds and deprecated packages.
Code analysis
C# 8 support has been enhanced with a number of new inspections and quick-fixes, most notably for nullable reference types. For instance, code analysis now takes into account JetBrains.Annotations attributes (both NotNull and CanBeNull) for API declared in code where nullable reference types are disabled (#nullable disable).
Also, nullability code analysis is now aware of more cases and can trace incorrect nullability through deconstruction and the foreach cycle, and it provides a corresponding quick-fix.
Refactorings
The Introduce Parameter and Introduce Field refactorings now ask which part of the expression you want the refactoring to be applied to.
The Conflicts dialog has received a makeover: we’ve turned the plain list into a tree grouped by file.
Plugins
The Markdown plugin is now bundled in Rider. It recognizes Markdown files in your solution, provides a dedicated editor for them, and shows the rendered HTML in a live preview.
With Azure Toolkit and Azurite, you can now start, stop, and clear the storage emulator in the Azurite node of the Services tool window. Also, code completion and validation is now available when editing NCrontab expressions.
The dotCover plugin offers export of coverage reports, quick search in Unit Tests Coverage window, and navigation from code to the coverage tree.
The dotTrace plugin can profile the native parts of Mono/Unity applications on Windows.
Godot run configurations have been reworked to make it easier to launch run, debug, and run with profiling.
Other updates
- We have a new installer for all the products covered by the dotUltimate license; to learn more about the updates to the licensing, please refer to the blog post.
- Support for compiled bindings with x:Bind is available with inspections and quick-fixes.
![]()
- File templates are now available in both Mac and iOS Xamarin projects. Xcode synchronization has been improved. If there is no .Designer.cs file, Rider now generates one instead of displaying an error.
![]()
- Dynamic Program Analysis now has include and exclude filters.
![]()
- New analyzers, highlighters, and quick-fixes have been added to the F# plugin. We’ve also taught Rider to rename the wildcard pattern and to apply the Introduce Variable refactoring to variables.
![]()
- We’ve made some improvements to database support, such as a separate editor for huge cell values, a new UI for boolean values, and a DML preview in the data editor.
![]()
- For web developers, we have new smart intentions in JavaScript code, in-text rendering of documentation comments, support for the Prettier plugin, and more updates to Vue support.
![]()
- We now support attaching the debugger to .NET core runtime hosting configurations and running them with debug.
- Run configurations are generated for all runnable projects.
- Project references for website projects are now supported.
- Search results in Search Everywhere have a new look.
See the full list of fixes completed in the 2020.2 release cycle on YouTrack.
That’s it for today! If you’re interested in learning more about these changes, please refer to the What’s New in Rider page. We appreciate your feedback, so please let us know what you think of Rider 2020.2 in the comments below, in our issue tracker, or on social media.
You can use any of these options to get Rider 2020.2:
- Download and install it from www.jetbrains.com.
- Update right inside Rider: Help | Check for updates.
- Use our Toolbox App.
- Use this snap package from the SnapCraft store if you are using a compatible Linux distro.
↧
↧
Debugger Extensions for Unity in Rider 2020.2
Rider 2020.2 has a lot of great new features for Unity, and debugging has certainly had its fair share of attention in this release.
We’ve already introduced “pausepoints”, a new kind of breakpoint that puts the Unity editor into pause mode when a condition is met in code, allowing you to use the Unity Inspector to see what’s going on at that point. And in the last post, we saw how Rider can help you debug players, either standalone on the desktop, or on mobile devices and consoles, including USB support for Apple devices. Today, we’re going to look at a set of small features that will make a big difference to how you debug your Unity projects.
One of the problems with debugging a Unity game is understanding your current context – if you’re debugging a MonoBehaviour script, which game object is it attached to? Where is it in the object hierarchy? What other components are attached to the game object? What’s the position of this Transform?
All of these questions and more can be answered through the debugger, but that often requires drilling down into objects, or evaluating expressions and calling methods, making you work to find these answers, rather than having the most useful information quickly and easily accessible.
Rider has made a whole load of little tweaks to how we display Unity values in the debugger, all designed to give you a better view of the current state of your project, and to make it easier to see this much needed context.
Rider does this in a number of ways. It will add extra items to the Watches and Variables tab, showing you the currently active scene, for example. It also adds extra child items to expanded values – the "Active Scene" item will show root game objects, and each GameObject shows child game objects and attached components, giving a view of the whole scene hierarchy. Rider has also updated the summary information displayed for some Unity types, pulling useful information up so it’s always visible, such as showing the position, rotation and scale of a Transform without having to expand the value. Let’s take a look at more details, and see some examples.
Active scene and the game object hierarchy
Whenever you hit a breakpoint, Rider will add an “Active Scene” item to the Variables and Watches tab, very much like an automatically created watch variable. This shows the active Scene object, as returned by SceneManager.GetActiveScene. The idea here is to give you the context you need for your Unity game, and the active scene is a great entry point for this. Collapsed, it will show the scene name and file path, and when expanded, you’ll not only see the normal debugger view of fields and properties, but you’ll also see a new group called “Game objects”. Expanding this item will list the root game objects in the scene.
Rider adds new items to GameObject instances, too. The “Children” group shows the child GameObjects of this instance, very much like how the “Game objects” group works for Scene. You can use this to get a debugger view of the entire object hierarchy of your scene. And don’t worry about performance – Rider collects these values on demand, so they’re not calculated unless they’re shown, and Rider will group results larger than one hundred game objects, so it will handle very large hierarchies, too.
You might notice a couple of other new values under GameObject. There’s a new “Components” group that shows all Component instances attached to the GameObject, such as Transform or any attached MonoBehaviour derived scripts. And there’s a new “Scene path” value that shows the location of the GameObject in the object hierarchy, as a path from the root object. This is also shown for Component instances, making it a little easier to see where a GameObject or Component is being used in the object hierarchy.
Finally, if the current object being debugged – i.e. this – is a Component such as a MonoBehaviour script, then Rider will add another “automatic watch variable”, this.gameObject. This does exactly what the name implies and shows the this.gameObject property. It would be very easy to expand this and find the gameObject value, but this simple addition pulls some useful context up to the top level to make it quicker and easier to find.
Improving summary info
So far, we’ve looked at only one way the debugger has to display values – the Variables and Watches tree view. This can show complex objects such as a class or struct by expanding the value to show fields and properties. But when collapsed, the debugger shows a brief summary, hopefully showing the most relevant information. You can also see this summary info in tooltips, and drawn on the editor surface.
This content comes from the object itself, either as the output of ToString() (which by default is simply the name of the object’s type, but can be overridden in derived objects), or from the [DebuggerDisplay(...)] attribute, which specifies field or property names in a string.
Unity doesn’t make much use of [DebuggerDisplay], but it does override ToString() in a number of places. Unfortunately, the output of ToString() is sometimes more appropriate to user facing output than it is to debugging. For example, the implementation of Vector3.ToString() defaults to showing the float values of x, y and z with the F1 format specifier. This means that each float value is shown to one decimal place. While this makes for a nice looking output, it’s not helpful when the summary and expanded view of an object are so different.
So Rider provides alternative summary information for a number of Unity types. This includes the Vector types, as well as Rect, Bounds, Plane, Ray and so on. Any Unity type that outputs float values at F1 has been overridden to show the field values at full precision, making it much easier to see, at a glance, what the value actually is.
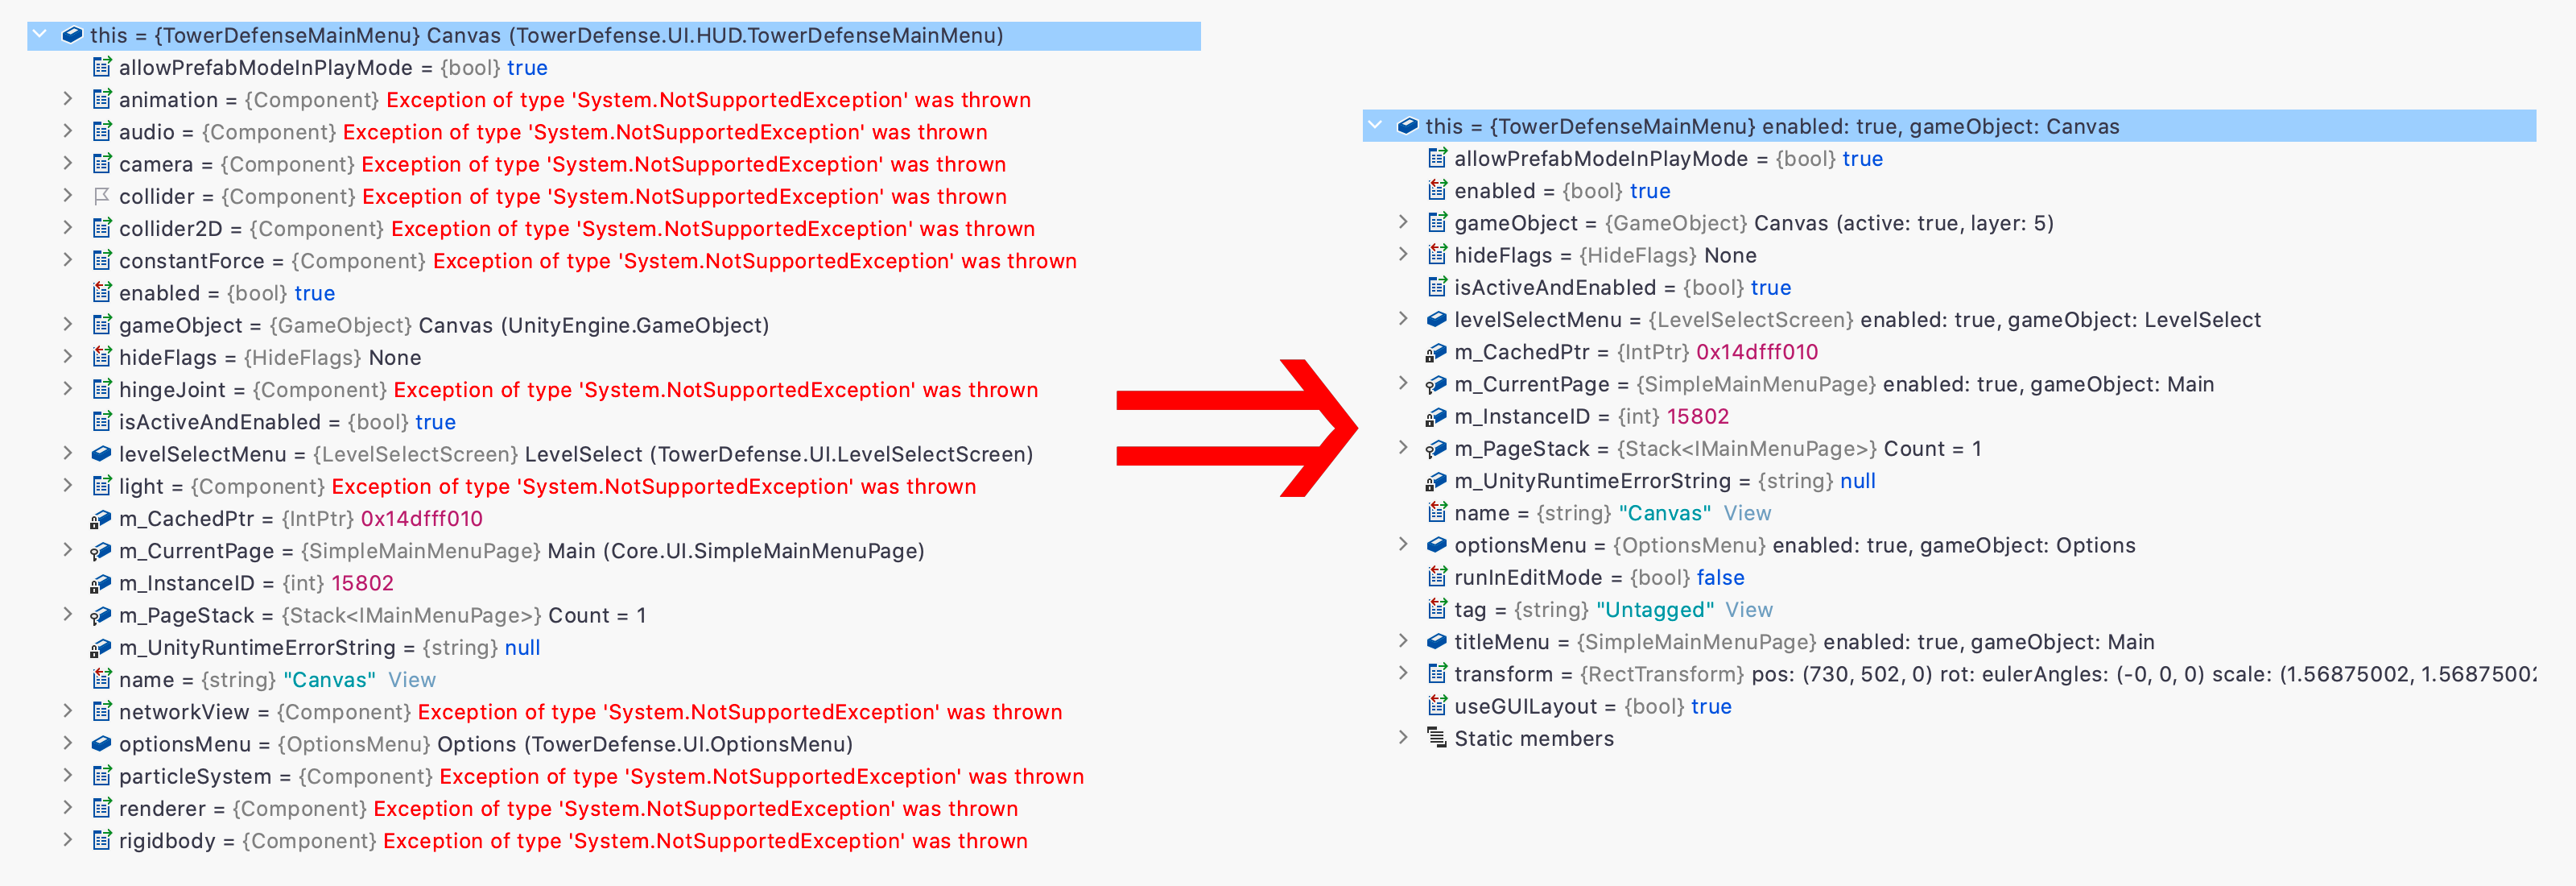
There are other types that Rider overrides like this. Transform is a great example. Transform derives from UnityEngine.Object, which provides an implementation of ToString that shows the name of the object and its type. The name of a component is always the name of the game object it’s attached to, so for a transform, this quite often shows something like "Cube (UnityEngine.Transform)". Wouldn’t it be better to show the local position, rotation and scale without having to expand the object?
Rider provides overrides for a few other Object based types – the MeshFilter component quickly shows the vertex count and Scene will show the scene name and file path. GameObject shows its name and the activeInHierarchy and layer properties. Objects deriving from Behaviour show the enabled flag, plus the name of the GameObject they’re attached to, surfacing the most important details to tooltips and summary information.
And don’t forget that you can add debugging information for you own types too – override ToString() or use [DebuggerDisplay(...)] to provide summary information, or use [DebuggerTypeProxy(typeof(...))] to specify an object to provide different fields and properties when you expand an object. And the [DebuggerBrowsable(...)] attribute can be used to hide a type member. See the docs for more information.
Round up
Of course, many of Rider’s other debugger features work just fine with Unity projects, too. Things like Pin to Top and setting the next statement, conditional and dependent breakpoints (these work great with pausepoints, too!), debugging decompiled code, and also the new Pin to Frame (although sadly, not the Data Breakpoints in that blog post, as that requires an API that is only available in .NET Core on Windows).
And finally, the best kind of new feature – we’ve removed something! Both GameObject and Component have a number of obsolete properties that do nothing but throw exceptions. They’re hidden from code completion with the [EditorBrowsable(EditorBrowsableState.Never)] attribute, but not hidden from the debugger with [DebuggerBrowsable(DebuggerBrowsableState.Never)]. You might have seen this in older versions of Rider – the exceptions aren’t causing any problems, but they do add a lot of noise. Rider now filters them out. Much cleaner!
Before we finish, it’s important to point out that all of these features are available when debugging your game in the editor, but not everything is available when debugging players. This is because the debugger can’t always get the information – some features require APIs that only exist when the application is running in the Unity editor, and others require fields or properties that are stripped from player builds. If it can get the data, the debugger will show it. If not, it will gracefully fall back, and you’ll see the standard ToString representation of the value.
Oh, and if you don’t want to see this extra information, you can disable it in the Preferences | Languages & Frameworks | Unity Engine settings page.
In the next few posts on Unity, we’ll take a look at analysis of Burst enabled code, the long awaited shader support, and perhaps we’ll have a quick round up of other changes. In the mean time, download Rider and try out the updated debugger on your own projects. We’re looking forward to your feedback!
↧
Webinar – Xamarin, MAUI and the reactive MVVM between them
Join us Thursday, September 17, 2020, 16:00 – 17:00 CEST (10:00 AM – 11:00 AM EDT or check other timezones) for our free live webinar, Xamarin, MAUI and the reactive MVVM between them, with Rodney Littles, II.
Register now and get a reminder, or join on YouTube
Xamarin Forms is the .NET cross platform technology that allows you to write an application in C# and target various operating systems, primarily mobile. The recommended architectural approach for .NET applications adhering to SOLID principles is Model-View-ViewModel (MVVM). ReactiveUI is a MVVM framework based on Reactive Extensions, which are a cross language approach to functional programming. During this talk we will take a trip through Xamarin, MVVM, ReactiveUI and show the future state of Xamarin, MAUI.
↧
The Rider 2020.2.1 and ReSharper 2020.2.1 Hotfixes Are Here!
We’ve just published two hotfix updates, Rider 2020.2.1 and ReSharper 2020.2.1. Here are the highlights of what we’ve introduced. For the full list of changes, please refer to our bug tracker.
Rider 2020.2.1
NuGet
- We’ve fixed the bug that caused all NuGet packages to be restored unnecessarily before building the project (RIDER-49125).
Unit testing
- NUnit2 tests are no longer left in an Inconclusive state with System.NullReferenceException (RSRP-480840).
- The option to run NUnit tests from a specified folder now works correctly (RIDER-49367).
- The appsettings.json file is read correctly when running xUnit tests (RIDER-49177).
- The Environment.CurrentDirectory setting for NUnit tests has been set to ‘Test assembly’s folder’ by default.
- A variety of other requests has been fixed – please refer to this bug tracker query for more information.
Unity
- Resolving INTERNAL_DATA macros and related functions has been improved (RIDER-48368).
- The behavior of the setting for suppressing errors in shaders has been updated: it now hides all resolve problems (RIDER-49123).
- We’ve also turned off errors from .shader files in the ‘Errors In Solution’ view.
ReSharper 2020.2.1
- We’ve eliminated the freeze on bulk operations, such as Remove unused references (RSRP-480776).
- A set of bug fixes in unit testing described above in Rider’s section.
At the moment we’re still investigating a list of issues in unit testing. We’re grateful for your feedback, and if there’re any other problems you’d like to let us know about, please feel free to file a request in our bug tracker, leave a comment to this post, or contact ReSharper’s or Rider’s support team.
You’ll find Rider 2020.2.1 and ReSharper 2020.2.1 on our website, or you can update using the Toolbox App.
↧